Honeywell 2007 Annual Report Download - page 101
Download and view the complete annual report
Please find page 101 of the 2007 Honeywell annual report below. You can navigate through the pages in the report by either clicking on the pages listed below, or by using the keyword search tool below to find specific information within the annual report.-
 1
1 -
2
-
3
-
4
-
5
-
6
-
7
-
8
-
9
-
10
-
11
-
12
-
13
-
14
-
15
-
16
-
17
-
18
-
19
-
20
-
21
-
22
-
23
-
24
-
25
-
26
-
27
-
28
-
29
-
30
-
31
-
32
-
33
-
34
-
35
-
36
-
37
-
38
-
39
-
40
-
41
-
42
-
43
-
44
-
45
-
46
-
47
-
48
-
49
-
50
-
51
-
52
-
53
-
54
-
55
-
56
-
57
-
58
-
59
-
60
-
61
-
62
-
63
-
64
-
65
-
66
-
67
-
68
-
69
-
70
-
71
-
72
-
73
-
74
-
75
-
76
-
77
-
78
-
79
-
80
-
81
-
82
-
83
-
84
-
85
-
86
-
87
-
88
-
89
-
90
-
 91
91 -
 92
92 -
 93
93 -
 94
94 -
 95
95 -
 96
96 -
 97
97 -
 98
98 -
 99
99 -
 100
100 -
 101
101 -
 102
102 -
 103
103 -
 104
104 -
 105
105 -
 106
106 -
 107
107 -
 108
108 -
 109
109 -
 110
110 -
 111
111 -
112
-
113
-
114
-
115
-
116
-
117
-
118
-
119
-
120
-
121
-
122
-
123
-
124
-
125
-
126
-
127
-
128
-
129
-
130
-
131
-
132
-
133
-
134
-
135
-
136
-
137
-
138
-
139
-
140
-
141
-
142
-
143
-
144
-
145
-
146
-
147
-
148
-
149
-
150
-
151
-
152
-
153
-
154
-
155
-
156
-
157
-
158
-
159
-
160
-
161
-
162
-
163
-
164
-
165
-
166
-
167
-
168
-
169
-
170
-
171
-
172
-
173
-
174
-
175
-
176
-
177
-
178
-
179
-
180
-
181
 |
 |
HONEYWELL INTERNATIONAL INC.
NOTES TO FINANCIAL STATEMENTS—(Continued)
(Dollars in millions, except per share amounts)
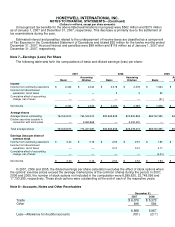
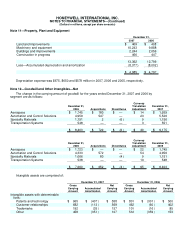
Intangible assets amortization expense was $162, $144 and $75 million in 2007, 2006 and 2005,
respectively. Estimated intangible assets amortization expense for each of the next five years approximates $190
million in 2008, $190 million in 2009, $180 million in 2010, $160 million in 2011 and $140 million in 2012.
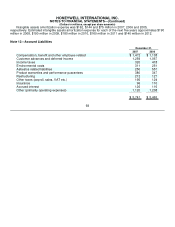
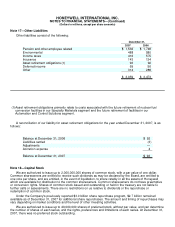
Note 13—Accrued Liabilities
December 31,
2007 2006
Compensation, benefit and other employee related $ 1,472 $ 1,138
Customer advances and deferred income 1,259 1,067
Income taxes 320 418
Environmental costs 311 251
Asbestos related liabilities 250 557
Product warranties and performance guarantees 380 347
Restructuring 212 127
Other taxes (payroll, sales, VAT etc.) 195 124
Insurance 96 110
Accrued interest 126 116
Other (primarily operating expenses) 1,120 1,208
$ 5,741 $ 5,463
69