Honeywell 2007 Annual Report Download - page 34
Download and view the complete annual report
Please find page 34 of the 2007 Honeywell annual report below. You can navigate through the pages in the report by either clicking on the pages listed below, or by using the keyword search tool below to find specific information within the annual report.-
 1
1 -
2
-
3
-
4
-
5
-
6
-
7
-
8
-
9
-
10
-
11
-
12
-
13
-
14
-
15
-
16
-
17
-
18
-
19
-
20
-
21
-
22
-
23
-
 24
24 -
 25
25 -
 26
26 -
 27
27 -
 28
28 -
 29
29 -
 30
30 -
 31
31 -
 32
32 -
 33
33 -
 34
34 -
 35
35 -
 36
36 -
 37
37 -
 38
38 -
 39
39 -
 40
40 -
 41
41 -
 42
42 -
 43
43 -
 44
44 -
45
-
46
-
47
-
48
-
49
-
50
-
51
-
52
-
53
-
54
-
55
-
56
-
57
-
58
-
59
-
60
-
61
-
62
-
63
-
64
-
65
-
66
-
67
-
68
-
69
-
70
-
71
-
72
-
73
-
74
-
75
-
76
-
77
-
78
-
79
-
80
-
81
-
82
-
83
-
84
-
85
-
86
-
87
-
88
-
89
-
90
-
91
-
92
-
93
-
94
-
95
-
96
-
97
-
98
-
99
-
100
-
101
-
102
-
103
-
104
-
105
-
106
-
107
-
108
-
109
-
110
-
111
-
112
-
113
-
114
-
115
-
116
-
117
-
118
-
119
-
120
-
121
-
122
-
123
-
124
-
125
-
126
-
127
-
128
-
129
-
130
-
131
-
132
-
133
-
134
-
135
-
136
-
137
-
138
-
139
-
140
-
141
-
142
-
143
-
144
-
145
-
146
-
147
-
148
-
149
-
150
-
151
-
152
-
153
-
154
-
155
-
156
-
157
-
158
-
159
-
160
-
161
-
162
-
163
-
164
-
165
-
166
-
167
-
168
-
169
-
170
-
171
-
172
-
173
-
174
-
175
-
176
-
177
-
178
-
179
-
180
-
181
 |
 |

•
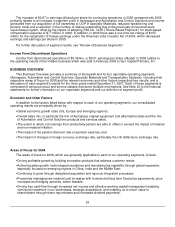
Utilizing our enablers Honeywell Operating System (HOS), Functional Transformation and Velocity Product
Development (VPD)ä to standardize the way we work, increase quality and reduce the costs of product
manufacturing, reduce costs and enhance the quality of our administrative functions and improve business
operations through investments in systems and process improvements;
•
Managing Corporate costs, including costs incurred for asbestos and environmental matters, pension and
other post-retirement expenses and our tax expense; and
•
Achieving productivity savings and price increases to offset inflation.
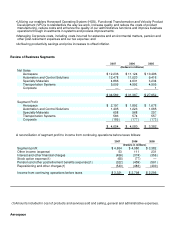
Review of Business Segments
2007 2006 2005
(Dollars in millions)
Net Sales
Aerospace $ 12,236 $ 11,124 $ 10,496
Automation and Control Solutions 12,478 11,020 9,416
Specialty Materials 4,866 4,631 3,234
Transportation Systems 5,009 4,592 4,505
Corporate — — 1
$ 34,589 $ 31,367 $ 27,652
Segment Profit
Aerospace $ 2,197 $ 1,892 $ 1,676
Automation and Control Solutions 1,405 1,223 1,065
Specialty Materials 658 568 257
Transportation Systems 583 574 557
Corporate (189) (177) (173)
$ 4,654 $ 4,080 $ 3,382
A reconciliation of segment profit to income from continuing operations before taxes follows:
2007 2006 2005
(Dollars in millions)
Segment profit $ 4,654 $ 4,080 $ 3,382
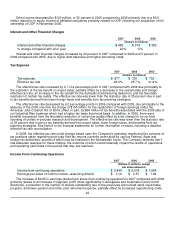
Other income (expense) 53 111 231
Interest and other financial charges (456) (374) (356)
Stock option expense(1) (65) (77) —
Pension and other postretirement benefits (expense)(1) (322) (459) (561)
Repositioning and other charges(1) (543) (483) (400)
Income from continuing operations before taxes $ 3,321 $ 2,798 $ 2,296
(1) Amounts included in cost of products and services sold and selling, general and administrative expenses.
Aerospace