Honeywell 2007 Annual Report Download - page 71
Download and view the complete annual report
Please find page 71 of the 2007 Honeywell annual report below. You can navigate through the pages in the report by either clicking on the pages listed below, or by using the keyword search tool below to find specific information within the annual report.-
 1
1 -
2
-
3
-
4
-
5
-
6
-
7
-
8
-
9
-
10
-
11
-
12
-
13
-
14
-
15
-
16
-
17
-
18
-
19
-
20
-
21
-
22
-
23
-
24
-
25
-
26
-
27
-
28
-
29
-
30
-
31
-
32
-
33
-
34
-
35
-
36
-
37
-
38
-
39
-
40
-
41
-
42
-
43
-
44
-
45
-
46
-
47
-
48
-
49
-
50
-
51
-
52
-
53
-
54
-
55
-
56
-
57
-
58
-
59
-
60
-
 61
61 -
 62
62 -
 63
63 -
 64
64 -
 65
65 -
 66
66 -
 67
67 -
 68
68 -
 69
69 -
 70
70 -
 71
71 -
 72
72 -
 73
73 -
 74
74 -
 75
75 -
 76
76 -
 77
77 -
 78
78 -
 79
79 -
 80
80 -
 81
81 -
82
-
83
-
84
-
85
-
86
-
87
-
88
-
89
-
90
-
91
-
92
-
93
-
94
-
95
-
96
-
97
-
98
-
99
-
100
-
101
-
102
-
103
-
104
-
105
-
106
-
107
-
108
-
109
-
110
-
111
-
112
-
113
-
114
-
115
-
116
-
117
-
118
-
119
-
120
-
121
-
122
-
123
-
124
-
125
-
126
-
127
-
128
-
129
-
130
-
131
-
132
-
133
-
134
-
135
-
136
-
137
-
138
-
139
-
140
-
141
-
142
-
143
-
144
-
145
-
146
-
147
-
148
-
149
-
150
-
151
-
152
-
153
-
154
-
155
-
156
-
157
-
158
-
159
-
160
-
161
-
162
-
163
-
164
-
165
-
166
-
167
-
168
-
169
-
170
-
171
-
172
-
173
-
174
-
175
-
176
-
177
-
178
-
179
-
180
-
181
 |
 |

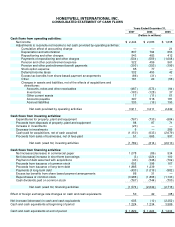
HONEYWELL INTERNATIONAL INC.
CONSOLIDATED STATEMENT OF CASH FLOWS
Years Ended December 31,
2007 2006 2005
(Dollars in millions)
Cash flows from operating activities:
Net income $ 2,444 $ 2,083 $ 1,638
Adjustments to reconcile net income to net cash provided by operating activities:
Cumulative effect of accounting change — — 21
Depreciation and amortization 837 794 653
Repositioning and other charges 543 483 412
Payments of repositioning and other charges (504) (559) (1,008)
Pension and other postretirement expense 322 459 561
Pension and other postretirement benefit payments (300) (353) (199)
Stock option expense 65 77 —
Deferred income taxes 332 450 42
Excess tax benefits from share based payment arrangements (86) (31) —
Other 161 20 (56)
Changes in assets and liabilities, net of the effects of acquisitions and
divestitures:
Accounts, notes and other receivables (467) (573) (94)
Inventories (183) (128) 37
Other current assets 17 (11) 61
Accounts payable 397 516 181
Accrued liabilities 333 (16) 193
Net cash provided by operating activities 3,911 3,211 2,442
Cash flows from investing activities:
Expenditures for property, plant and equipment (767) (733) (684)
Proceeds from disposals of property, plant and equipment 98 87 71
Increase in investments (20) — —
Decrease in investments 6 — 285
Cash paid for acquisitions, net of cash acquired (1,150) (633) (2,679)
Proceeds from sales of businesses, net of fees paid 51 665 997
Net cash (used for) investing activities (1,782) (614) (2,010)
Cash flows from financing activities:
Net increase/(decrease) in commercial paper 1,078 (86) 534
Net (decrease)/increase in short-term borrowings (3) (224) 100
Payment of debt assumed with acquisitions (40) (346) (702)
Proceeds from issuance of common stock 603 396 167
Proceeds from issuance of long-term debt 1,885 1,239 —
Payments of long-term debt (430) (1,019) (982)
Excess tax benefits from share based payment arrangements 86 31 —
Repurchases of common stock (3,986) (1,896) (1,133)
Cash dividends paid on common stock (767) (744) (700)
Net cash (used for) financing activities (1,574) (2,649) (2,716)
Effect of foreign exchange rate changes on cash and cash equivalents 50 42 (68)
Net increase/(decrease) in cash and cash equivalents 605 (10) (2,352)
Cash and cash equivalents at beginning of period 1,224 1,234 3,586
Cash and cash equivalents at end of period $ 1,829 $ 1,224 $ 1,234