Honeywell 2007 Annual Report Download - page 40
Download and view the complete annual report
Please find page 40 of the 2007 Honeywell annual report below. You can navigate through the pages in the report by either clicking on the pages listed below, or by using the keyword search tool below to find specific information within the annual report.-
 1
1 -
2
-
3
-
4
-
5
-
6
-
7
-
8
-
9
-
10
-
11
-
12
-
13
-
14
-
15
-
16
-
17
-
18
-
19
-
20
-
21
-
22
-
23
-
24
-
25
-
26
-
27
-
28
-
29
-
 30
30 -
 31
31 -
 32
32 -
 33
33 -
 34
34 -
 35
35 -
 36
36 -
 37
37 -
 38
38 -
 39
39 -
 40
40 -
 41
41 -
 42
42 -
 43
43 -
 44
44 -
 45
45 -
 46
46 -
 47
47 -
 48
48 -
 49
49 -
 50
50 -
51
-
52
-
53
-
54
-
55
-
56
-
57
-
58
-
59
-
60
-
61
-
62
-
63
-
64
-
65
-
66
-
67
-
68
-
69
-
70
-
71
-
72
-
73
-
74
-
75
-
76
-
77
-
78
-
79
-
80
-
81
-
82
-
83
-
84
-
85
-
86
-
87
-
88
-
89
-
90
-
91
-
92
-
93
-
94
-
95
-
96
-
97
-
98
-
99
-
100
-
101
-
102
-
103
-
104
-
105
-
106
-
107
-
108
-
109
-
110
-
111
-
112
-
113
-
114
-
115
-
116
-
117
-
118
-
119
-
120
-
121
-
122
-
123
-
124
-
125
-
126
-
127
-
128
-
129
-
130
-
131
-
132
-
133
-
134
-
135
-
136
-
137
-
138
-
139
-
140
-
141
-
142
-
143
-
144
-
145
-
146
-
147
-
148
-
149
-
150
-
151
-
152
-
153
-
154
-
155
-
156
-
157
-
158
-
159
-
160
-
161
-
162
-
163
-
164
-
165
-
166
-
167
-
168
-
169
-
170
-
171
-
172
-
173
-
174
-
175
-
176
-
177
-
178
-
179
-
180
-
181
 |
 |

•
Industrial production;
•
U.S. and European economic conditions;
•
Economic growth rates in emerging markets;
•
The strength of capital spending on process (including petrochemical and refining) and building automation;
and
•
Changes to energy, fire, security, health care, safety and environmental concerns and regulations.
Results of Operations
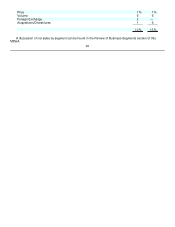
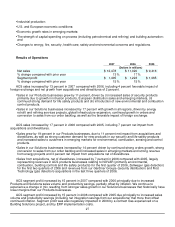
2007 2006 2005
(Dollars in millions)
Net sales $ 12,478 $ 11,020 $ 9,416
% change compared with prior year 13% 17%
Segment profit $ 1,405 $ 1,223 $ 1,065
% change compared with prior year 15% 15%
ACS sales increased by 13 percent in 2007 compared with 2006, including 4 percent favorable impact of
foreign exchange and net growth from acquisitions and divestitures of 2 percent.
• Sales in our Products businesses grew by 11 percent, driven by (i) increased sales of security products
primarily due to growth in intrusion products, European distribution sales and emerging markets, (ii)
continued strong demand for life safety products and (iii) introduction of new environmental and combustion
control products.
•
Sales in our Solutions businesses increased by 17 percent with growth in all regions, driven by energy
retrofit and refining services projects, global infrastructure expansion, continued growth in orders and
conversion to sales from our order backlog, as well as the favorable impact of foreign exchange.
ACS sales increased by 17 percent in 2006 compared with 2005, including 7 percent net impact from
acquisitions and divestitures.
• Sales grew by 19 percent in our Products businesses, due to 11 percent net impact from acquisitions and
divestitures, as well as strong customer demand for new products in our security and life safety products
and increased sales to customers in emerging markets for environmental, combustion, sensing and control
products.
•
Sales in our Solutions businesses increased by 14 percent driven by continued strong orders growth, strong
conversion to sales from our order backlog and increased sales in emerging markets and strong revenue
from energy projects and 3 percent net impact from acquisitions net of divestitures.
•
Sales from acquisitions, net of divestitures, increased by 7 percent in 2006 compared with 2005, largely
representing revenues in ACS products businesses relating to NOVAR (primarily environmental,
combustion, building controls and life safety products) for the first quarter of 2006, Zellweger (gas detection)
for the first two quarters of 2006 and revenues from our Gardiner Groupe (security distribution) and First
Technology (gas detection) acquisitions in the last three quarters of 2006.
ACS segment profit increased by 15 percent in 2007 compared with 2006 principally due to increased
Products and Solutions sales volume and productivity savings, partially offset by inflation. We continue to
experience a change in mix resulting from stronger sales growth in our Solutions businesses that historically have
lower margins than our Products businesses.
ACS segment profit increased by 15 percent in 2006 compared with 2005 due principally to increased sales
volume and productivity savings (including net integration savings from our acquisitions) that more than offset
continued inflation. Segment profit was also negatively impacted in 2006 by a contract loss experienced on a
Building Solutions project, and by ERP implementation costs.
27