Honeywell 2007 Annual Report Download - page 45
Download and view the complete annual report
Please find page 45 of the 2007 Honeywell annual report below. You can navigate through the pages in the report by either clicking on the pages listed below, or by using the keyword search tool below to find specific information within the annual report.-
 1
1 -
2
-
3
-
4
-
5
-
6
-
7
-
8
-
9
-
10
-
11
-
12
-
13
-
14
-
15
-
16
-
17
-
18
-
19
-
20
-
21
-
22
-
23
-
24
-
25
-
26
-
27
-
28
-
29
-
30
-
31
-
32
-
33
-
34
-
 35
35 -
 36
36 -
 37
37 -
 38
38 -
 39
39 -
 40
40 -
 41
41 -
 42
42 -
 43
43 -
 44
44 -
 45
45 -
 46
46 -
 47
47 -
 48
48 -
 49
49 -
 50
50 -
 51
51 -
 52
52 -
 53
53 -
 54
54 -
 55
55 -
56
-
57
-
58
-
59
-
60
-
61
-
62
-
63
-
64
-
65
-
66
-
67
-
68
-
69
-
70
-
71
-
72
-
73
-
74
-
75
-
76
-
77
-
78
-
79
-
80
-
81
-
82
-
83
-
84
-
85
-
86
-
87
-
88
-
89
-
90
-
91
-
92
-
93
-
94
-
95
-
96
-
97
-
98
-
99
-
100
-
101
-
102
-
103
-
104
-
105
-
106
-
107
-
108
-
109
-
110
-
111
-
112
-
113
-
114
-
115
-
116
-
117
-
118
-
119
-
120
-
121
-
122
-
123
-
124
-
125
-
126
-
127
-
128
-
129
-
130
-
131
-
132
-
133
-
134
-
135
-
136
-
137
-
138
-
139
-
140
-
141
-
142
-
143
-
144
-
145
-
146
-
147
-
148
-
149
-
150
-
151
-
152
-
153
-
154
-
155
-
156
-
157
-
158
-
159
-
160
-
161
-
162
-
163
-
164
-
165
-
166
-
167
-
168
-
169
-
170
-
171
-
172
-
173
-
174
-
175
-
176
-
177
-
178
-
179
-
180
-
181
 |
 |

Economic and Other Factors
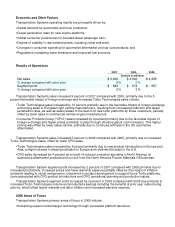
Transportation Systems operating results are principally driven by:
• Global demand for automobile and truck production;
•
Diesel penetration rates for new engine platforms;
•
Global consumer preferences for boosted diesel passenger cars;
•
Degree of volatility in raw material prices, including nickel and steel;
•
Changes in consumer spending for automotive aftermarket and car care products; and
•
Regulations mandating lower emissions and improved fuel economy.
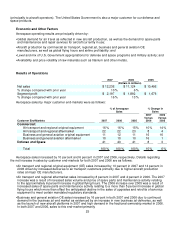
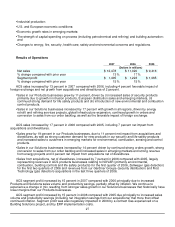
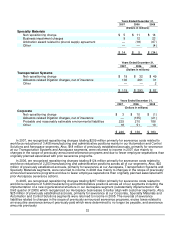
Results of Operations
2007 2006 2005
(Dollars in millions)
Net sales $ 5,009 $ 4,592 $ 4,505
% change compared with prior year 9% 2%
Segment profit $ 583 $ 574 $ 557
% change compared with prior year 2% 3%
Transportation Systems sales increased 9 percent in 2007 compared with 2006, primarily due to the 5
percent favorable impact of foreign exchange and increased Turbo Technologies sales volume.
• Turbo Technologies sales increased by 12 percent primarily due to the favorable impact of foreign exchange
and strong sales to European light vehicle manufacturers, resulting from increased production and diesel
penetration rates, as well as sales related to the launch of new turbo platforms by these customers, partially
offset by lower sales to commercial vehicle engine manufacturers.
•
Consumer Products Group ("CPG") sales increased by 4 percent primarily due to the favorable impact of
foreign exchange and higher prices (primarily to pass through ethylene glycol cost increases). This higher
pricing was offset by lower sales volume, primarily due to continued softness in the US automotive
aftermarket.
Transportation Systems sales increased 2 percent in 2006 compared with 2005, primarily due to increased
Turbo Technologies sales, offset by lower CPG sales.
• Turbo Technologies sales increased by 6 percent primarily due to new product introductions in Europe and
Asia, a slight increase in diesel penetration in Europe and relatively flat sales in the U.S.
•
CPG sales decreased by 4 percent as a result of reduced consumer spending in North America on
automotive aftermarket products and our exit from the North America Friction Materials OE business.
Transportation System segment profit increased by 2 percent in 2007 compared with 2006 primarily due to
increased productivity, increased prices and lower warranty expense partially offset by the impact of inflation
(primarily relating to nickel components), investment in product development to support future Turbo platforms,
costs associated with CPG product introductions and CPG operational planning and production issues.
Transportation Systems segment profit increased by 3 percent in 2006 compared with 2005 due primarily to
increased Turbo Technologies volume and productivity savings including the benefits of prior year restructuring
actions, which offset higher material and labor inflation and increased warranty expense.
2008 Areas of Focus
Transportation Systems primary areas of focus in 2008 include:
• Sustaining superior turbocharger technology through successful platform launches;