Honeywell 2007 Annual Report Download - page 44
Download and view the complete annual report
Please find page 44 of the 2007 Honeywell annual report below. You can navigate through the pages in the report by either clicking on the pages listed below, or by using the keyword search tool below to find specific information within the annual report.-
 1
1 -
2
-
3
-
4
-
5
-
6
-
7
-
8
-
9
-
10
-
11
-
12
-
13
-
14
-
15
-
16
-
17
-
18
-
19
-
20
-
21
-
22
-
23
-
24
-
25
-
26
-
27
-
28
-
29
-
30
-
31
-
32
-
33
-
 34
34 -
 35
35 -
 36
36 -
 37
37 -
 38
38 -
 39
39 -
 40
40 -
 41
41 -
 42
42 -
 43
43 -
 44
44 -
 45
45 -
 46
46 -
 47
47 -
 48
48 -
 49
49 -
 50
50 -
 51
51 -
 52
52 -
 53
53 -
 54
54 -
55
-
56
-
57
-
58
-
59
-
60
-
61
-
62
-
63
-
64
-
65
-
66
-
67
-
68
-
69
-
70
-
71
-
72
-
73
-
74
-
75
-
76
-
77
-
78
-
79
-
80
-
81
-
82
-
83
-
84
-
85
-
86
-
87
-
88
-
89
-
90
-
91
-
92
-
93
-
94
-
95
-
96
-
97
-
98
-
99
-
100
-
101
-
102
-
103
-
104
-
105
-
106
-
107
-
108
-
109
-
110
-
111
-
112
-
113
-
114
-
115
-
116
-
117
-
118
-
119
-
120
-
121
-
122
-
123
-
124
-
125
-
126
-
127
-
128
-
129
-
130
-
131
-
132
-
133
-
134
-
135
-
136
-
137
-
138
-
139
-
140
-
141
-
142
-
143
-
144
-
145
-
146
-
147
-
148
-
149
-
150
-
151
-
152
-
153
-
154
-
155
-
156
-
157
-
158
-
159
-
160
-
161
-
162
-
163
-
164
-
165
-
166
-
167
-
168
-
169
-
170
-
171
-
172
-
173
-
174
-
175
-
176
-
177
-
178
-
179
-
180
-
181
 |
 |

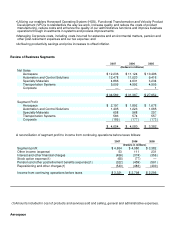
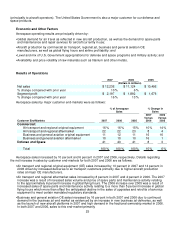
Organic growth was 7 percent in 2006 primarily due to higher volume and prices. Organic sales in our
Fluorine Products business increased by 9 percent due to continued strong demand for non- ozone depleting
HFC products, and organic growth in our Resins and Chemicals business was 4 percent, primarily due to price
increases to recover increased raw material costs. Both of these businesses experienced lower sales growth in
the fourth quarter of 2006 due to the slowdown in the US residential housing industry. Our Resins and Chemicals
business was also negatively impacted by a partial facility outage in the second half of 2006. Specialty Products
organic sales increased by 10 percent due to higher sales to our customers in the semiconductor industry and
increased sales of our specialty additives and our advanced fiber body armor. In 2005, organic sales increased
by 4 percent, largely as a result of higher prices of 7 percent primarily in our Resins and Chemicals and Fluorine
businesses, offsetting lower volumes in Specialty Products businesses.
Sales from acquisitions, net of divestitures grew by 36 percent in 2006 compared to 2005. This was due to a
44 percent growth in sales from UOP, which was consolidated into the Specialty Materials segment following our
acquisition of the remaining 50 percent interest in UOP in November 2005. Prior to that date, UOP results were
included in other income. UOP sales have grown due to continued strength in the petrochemical and refining
industries. This growth was offset by the loss of sales of 8 percent principally from the divestiture of our Industrial
Wax and North American Nylon Fiber businesses.
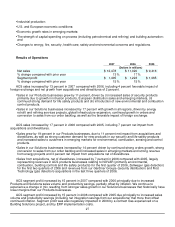
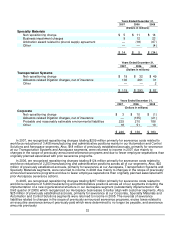
Specialty Materials segment profit increased by 16 percent in 2007 compared with 2006 principally due to
increased UOP and Specialty Products sales partially offset by the decline in Fluorine Products sales as a result
of the factors discussed above. Additionally, the effects of increased pricing and productivity more than offset raw
material and other cost inflation.
Specialty Materials segment profit increased by 121 percent in 2006 compared with 2005 due principally to
the impact of the UOP acquisition, net of divestitures, and increased organic growth and productivity savings (net
of the lost margin from the partial facility outage). Price increases (including benefits from formula based pricing
contracts) offset the impact of continued inflation in raw material costs.
2008 Areas of Focus
Specialty Materials primary areas of focus for 2008 include:
• Improving plant operational performance;
•
Increasing resources and market penetration in emerging regions;
•
Developing new products that address energy efficiency, renewable energy sources, global warming and
security regulations;
•
Increasing product differentiation;
•
Continued contract wins and development of new process technologies and products in the petrochemical
and refining industries; and
•
Achieving productivity savings and pricing actions to offset inflation.
Transportation Systems
Overview
Transportation Systems provides automotive products that improve the performance, efficiency, and
appearance of cars, trucks, and other vehicles through state-of-the-art technologies, world class brands and
global solutions to customers' needs. Transportation Systems' products include turbochargers and charge-air and
thermal systems; car care products including anti-freeze (Prestone(R)), filters (Fram(R)), spark plugs
(Autolite(R)), and cleaners, waxes and additives (Holts(R)); and brake hard parts and other friction materials
(Bendix(R) and Jurid(R)). Transportation Systems sells its products to OE automotive and truck manufacturers
(e.g., BMW, Caterpillar, Daimler, Renault, Ford, and Volkswagen), wholesalers and distributors and through the
retail aftermarket.
29