Honeywell 2007 Annual Report Download - page 142
Download and view the complete annual report
Please find page 142 of the 2007 Honeywell annual report below. You can navigate through the pages in the report by either clicking on the pages listed below, or by using the keyword search tool below to find specific information within the annual report.-
 1
1 -
2
-
3
-
4
-
5
-
6
-
7
-
8
-
9
-
10
-
11
-
12
-
13
-
14
-
15
-
16
-
17
-
18
-
19
-
20
-
21
-
22
-
23
-
24
-
25
-
26
-
27
-
28
-
29
-
30
-
31
-
32
-
33
-
34
-
35
-
36
-
37
-
38
-
39
-
40
-
41
-
42
-
43
-
44
-
45
-
46
-
47
-
48
-
49
-
50
-
51
-
52
-
53
-
54
-
55
-
56
-
57
-
58
-
59
-
60
-
61
-
62
-
63
-
64
-
65
-
66
-
67
-
68
-
69
-
70
-
71
-
72
-
73
-
74
-
75
-
76
-
77
-
78
-
79
-
80
-
81
-
82
-
83
-
84
-
85
-
86
-
87
-
88
-
89
-
90
-
91
-
92
-
93
-
94
-
95
-
96
-
97
-
98
-
99
-
100
-
101
-
102
-
103
-
104
-
105
-
106
-
107
-
108
-
109
-
110
-
111
-
112
-
113
-
114
-
115
-
116
-
117
-
118
-
119
-
120
-
121
-
122
-
123
-
124
-
125
-
126
-
127
-
128
-
129
-
130
-
131
-
 132
132 -
 133
133 -
 134
134 -
 135
135 -
 136
136 -
 137
137 -
 138
138 -
 139
139 -
 140
140 -
 141
141 -
 142
142 -
 143
143 -
 144
144 -
 145
145 -
 146
146 -
 147
147 -
 148
148 -
 149
149 -
 150
150 -
 151
151 -
 152
152 -
153
-
154
-
155
-
156
-
157
-
158
-
159
-
160
-
161
-
162
-
163
-
164
-
165
-
166
-
167
-
168
-
169
-
170
-
171
-
172
-
173
-
174
-
175
-
176
-
177
-
178
-
179
-
180
-
181
 |
 |
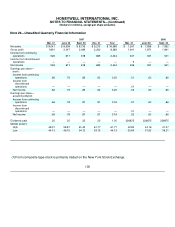
HONEYWELL INTERNATIONAL INC.
NOTES TO FINANCIAL STATEMENTS—(Continued)
(Dollars in millions, except per share amounts)
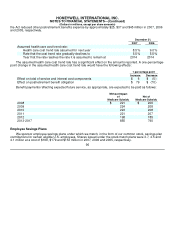
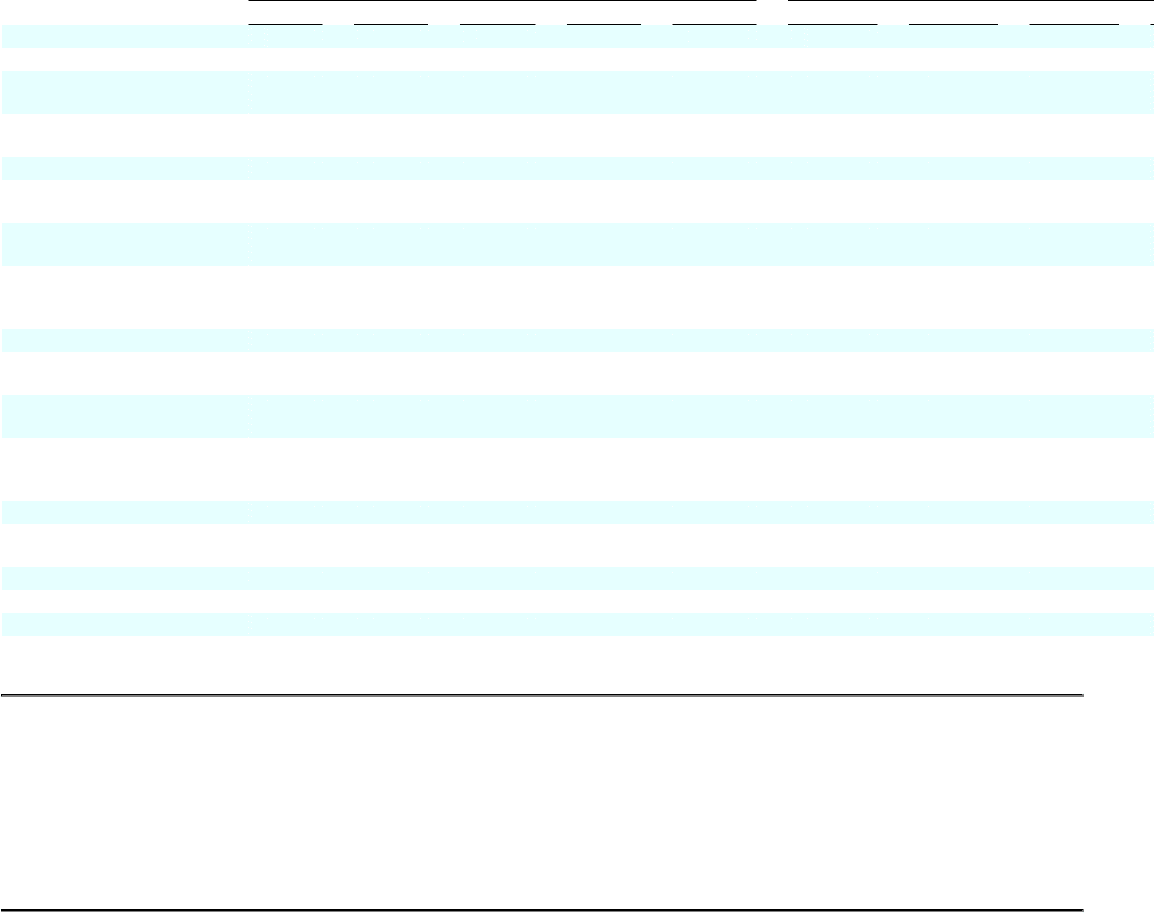
Note 26—Unaudited Quarterly Financial Information
2007 2006
Mar. 31 June 30 Sept. 30 Dec. 31 Year Mar. 31 June 30 Sept. 30
Net sales $ 8,041 $ 8,538 $ 8,735 $ 9,275 $ 34,589 $ 7,241 $ 7,898 $ 7,952 $
Gross profit 1,891 2,047 2,089 2,262 8,289 1,641 1,871 1,841
Income from continuing
operations 526 611 618 689 2,444 431 521 541
Income from discontinued
operations — — — — — 5 — —
Net income 526 611 618 689 2,444 436 521 541
Earnings per share—
basic:
Income from continuing
operations .66 .79 .83 .92 3.20 .51 .63 .66
Income from
discontinued
operations — — — — — .01 — —
Net income .66 .79 .83 .92 3.20 .52 .63 .66
Earnings per share—
assuming dilution:
Income from continuing
operations .66 .78 .81 .91 3.16 .51 .63 .66
Income from
discontinued
operations — — — — — .01 — —
Net income .66 .78 .81 .91 3.16 .52 .63 .66
Dividends paid .25 .25 .25 .25 1.00 .
226875 .
226875 .
226875
Market price(1)
High 48.31 58.87 61.45 61.77 61.77 42.85 44.16 41.37
Low 44.13 46.15 54.12 53.19 44.13 35.84 37.62 36.21
(1) From composite tape-stock is primarily traded on the New York Stock Exchange.
100