Honeywell 2007 Annual Report Download - page 32
Download and view the complete annual report
Please find page 32 of the 2007 Honeywell annual report below. You can navigate through the pages in the report by either clicking on the pages listed below, or by using the keyword search tool below to find specific information within the annual report.-
 1
1 -
2
-
3
-
4
-
5
-
6
-
7
-
8
-
9
-
10
-
11
-
12
-
13
-
14
-
15
-
16
-
17
-
18
-
19
-
20
-
21
-
 22
22 -
 23
23 -
 24
24 -
 25
25 -
 26
26 -
 27
27 -
 28
28 -
 29
29 -
 30
30 -
 31
31 -
 32
32 -
 33
33 -
 34
34 -
 35
35 -
 36
36 -
 37
37 -
 38
38 -
 39
39 -
 40
40 -
 41
41 -
 42
42 -
43
-
44
-
45
-
46
-
47
-
48
-
49
-
50
-
51
-
52
-
53
-
54
-
55
-
56
-
57
-
58
-
59
-
60
-
61
-
62
-
63
-
64
-
65
-
66
-
67
-
68
-
69
-
70
-
71
-
72
-
73
-
74
-
75
-
76
-
77
-
78
-
79
-
80
-
81
-
82
-
83
-
84
-
85
-
86
-
87
-
88
-
89
-
90
-
91
-
92
-
93
-
94
-
95
-
96
-
97
-
98
-
99
-
100
-
101
-
102
-
103
-
104
-
105
-
106
-
107
-
108
-
109
-
110
-
111
-
112
-
113
-
114
-
115
-
116
-
117
-
118
-
119
-
120
-
121
-
122
-
123
-
124
-
125
-
126
-
127
-
128
-
129
-
130
-
131
-
132
-
133
-
134
-
135
-
136
-
137
-
138
-
139
-
140
-
141
-
142
-
143
-
144
-
145
-
146
-
147
-
148
-
149
-
150
-
151
-
152
-
153
-
154
-
155
-
156
-
157
-
158
-
159
-
160
-
161
-
162
-
163
-
164
-
165
-
166
-
167
-
168
-
169
-
170
-
171
-
172
-
173
-
174
-
175
-
176
-
177
-
178
-
179
-
180
-
181
 |
 |

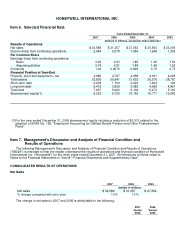
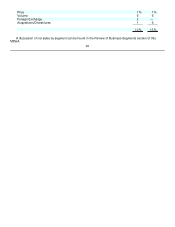
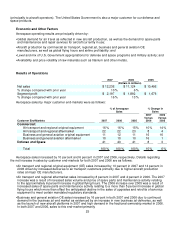
Other income decreased by $120 million, or 52 percent in 2006 compared to 2005 primarily due to a $121
million reduction in equity income of affiliated companies primarily related to UOP, following our acquisition of full
ownership of UOP in November 2005.
Interest and Other Financial Charges
2007 2006 2005
(Dollars in millions)
Interest and other financial charges $ 456 $ 374 $ 356
% change compared with prior year 22% 5%
Interest and other financial charges increased by 22 percent in 2007 compared to 2006 and 5 percent in
2006 compared with 2005, due to higher debt balances and higher borrowing costs.
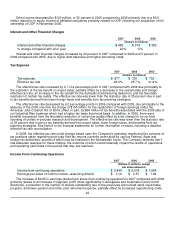
Tax Expense
2007 2006 2005
(Dollars in millions)
Tax expense $ 877 $ 720 $ 732
Effective tax rate 26.4% 25.7% 31.9%
The effective tax rate increased by 0.7 of a percentage point in 2007 compared with 2006 due principally to
the expiration of the tax benefit on export sales, partially offset by a decrease in the overall state and foreign
effective tax rate, an increase in the tax benefit for the domestic manufacturing deduction, and the favorable
resolution of certain tax audits. The effective tax rate was lower than the statutory rate of 35 percent due in part
to tax benefits derived from lower foreign taxes and benefits from tax planning strategies.
The effective tax rate decreased by 6.2 percentage points in 2006 compared with 2005, due principally to the
absence of the 2005 one-time tax charge of $155 million for the repatriation of foreign earnings under the
American Jobs Creation Act of 2004, offset, in part, by $64 million of tax benefits associated with the 2005 sale of
our Industrial Wax business which had a higher tax basis than book basis. In addition, in 2006, there were
benefits recognized from the favorable resolution of certain tax audits offset by a tax charge for an up-front
licensing of certain in-process research and development. The effective tax rate was lower than the statutory rate
of 35 percent due in part to tax benefits derived from export sales, lower foreign taxes, and benefits from tax
planning strategies. See Note 6 to the financial statements for further information on taxes, including a detailed
effective tax rate reconciliation.
In 2008, the effective tax rate could change based upon the Company's operating results and the outcome of
tax positions taken regarding previously filed tax returns currently under audit by various Federal, State and
foreign tax authorities, several of which may be finalized in the foreseeable future. The Company believes that it
has adequate reserves for these matters, the outcome of which could materially impact the results of operations
and operating cash flows in the period that they are resolved.
Income From Continuing Operations
2007 2006 2005
(Dollars in millions, except
per share amounts)
Income from continuing operations $ 2,444 $ 2,078 $ 1,564
Earnings per share of common stock—assuming dilution $ 3.16 $ 2.51 $ 1.84
The increase of $0.65 in earnings (diluted) per share from continuing operations in 2007 compared with 2006
primarily relates to an increase in segment profit (most significantly in Aerospace and Automation and Control
Solutions), a reduction in the number of shares outstanding due to the previously announced stock repurchase
program, and lower pension and other post retirement expense, partially offset by increased repositioning costs.
22