Honeywell 2007 Annual Report Download - page 112
Download and view the complete annual report
Please find page 112 of the 2007 Honeywell annual report below. You can navigate through the pages in the report by either clicking on the pages listed below, or by using the keyword search tool below to find specific information within the annual report.-
 1
1 -
2
-
3
-
4
-
5
-
6
-
7
-
8
-
9
-
10
-
11
-
12
-
13
-
14
-
15
-
16
-
17
-
18
-
19
-
20
-
21
-
22
-
23
-
24
-
25
-
26
-
27
-
28
-
29
-
30
-
31
-
32
-
33
-
34
-
35
-
36
-
37
-
38
-
39
-
40
-
41
-
42
-
43
-
44
-
45
-
46
-
47
-
48
-
49
-
50
-
51
-
52
-
53
-
54
-
55
-
56
-
57
-
58
-
59
-
60
-
61
-
62
-
63
-
64
-
65
-
66
-
67
-
68
-
69
-
70
-
71
-
72
-
73
-
74
-
75
-
76
-
77
-
78
-
79
-
80
-
81
-
82
-
83
-
84
-
85
-
86
-
87
-
88
-
89
-
90
-
91
-
92
-
93
-
94
-
95
-
96
-
97
-
98
-
99
-
100
-
101
-
 102
102 -
 103
103 -
 104
104 -
 105
105 -
 106
106 -
 107
107 -
 108
108 -
 109
109 -
 110
110 -
 111
111 -
 112
112 -
 113
113 -
 114
114 -
 115
115 -
 116
116 -
 117
117 -
 118
118 -
 119
119 -
 120
120 -
 121
121 -
 122
122 -
123
-
124
-
125
-
126
-
127
-
128
-
129
-
130
-
131
-
132
-
133
-
134
-
135
-
136
-
137
-
138
-
139
-
140
-
141
-
142
-
143
-
144
-
145
-
146
-
147
-
148
-
149
-
150
-
151
-
152
-
153
-
154
-
155
-
156
-
157
-
158
-
159
-
160
-
161
-
162
-
163
-
164
-
165
-
166
-
167
-
168
-
169
-
170
-
171
-
172
-
173
-
174
-
175
-
176
-
177
-
178
-
179
-
180
-
181
 |
 |

HONEYWELL INTERNATIONAL INC.
NOTES TO FINANCIAL STATEMENTS—(Continued)
(Dollars in millions, except per share amounts)
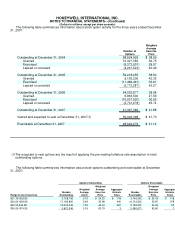
The following table summarizes information about stock option activity for the three years ended December
31, 2007:
Number of
Options
Weighted
Average
Exercise
Price
Outstanding at December 31, 2004 58,524,929 $ 38.09
Granted 10,327,350 36.75
Exercised (5,372,501) 29.07
Lapsed or canceled (4,261,523) 40.46
Outstanding at December 31, 2005 59,218,255 38.50
Granted 9,193,200 42.35
Exercised (11,466,491) 33.61
Lapsed or canceled (2,712,287) 42.27
Outstanding at December 31, 2006 54,232,677 39.98
Granted 5,963,500 47.59
Exercised (16,037,530) 36.95
Lapsed or canceled (2,761,278) 45.74
Outstanding at December 31, 2007 41,397,369 $ 41.88
Vested and expected to vest at December 31, 2007(1) 39,026,398 $ 41.70
Exercisable at December 31, 2007 28,624,279 $ 41.14
(1) The expected to vest options are the result of applying the pre-vesting forfeiture rate assumption to total
outstanding options.
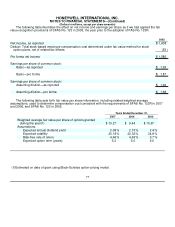
The following table summarizes information about stock options outstanding and exercisable at December
31, 2007:
Range of exercise prices
Options Outstanding Options Exercisable
Number
Outstanding
Weighted
Average
Life(1)
Weighted
Average
Exercise
Price
Aggregate
Intrinsic
Value Number
Exercisable
Weighted
Average
Exercise
Price
Aggregate
Intrinsic
Value
$21.75–$32.99 3,158,742 5.15 $ 24.20 $ 118 3,146,342 $ 24.19 $ 118
$33.00–$39.99 17,183,835 5.49 35.98 440 14,712,835 35.87 378
$40.00-$49.99 15,232,246 7.50 44.44 261 5,184,431 43.26 95
$50.00–$74.95 5,822,546 2.16 62.19 3 5,580,671 62.60 1