Honeywell 2007 Annual Report Download - page 111
Download and view the complete annual report
Please find page 111 of the 2007 Honeywell annual report below. You can navigate through the pages in the report by either clicking on the pages listed below, or by using the keyword search tool below to find specific information within the annual report.-
 1
1 -
2
-
3
-
4
-
5
-
6
-
7
-
8
-
9
-
10
-
11
-
12
-
13
-
14
-
15
-
16
-
17
-
18
-
19
-
20
-
21
-
22
-
23
-
24
-
25
-
26
-
27
-
28
-
29
-
30
-
31
-
32
-
33
-
34
-
35
-
36
-
37
-
38
-
39
-
40
-
41
-
42
-
43
-
44
-
45
-
46
-
47
-
48
-
49
-
50
-
51
-
52
-
53
-
54
-
55
-
56
-
57
-
58
-
59
-
60
-
61
-
62
-
63
-
64
-
65
-
66
-
67
-
68
-
69
-
70
-
71
-
72
-
73
-
74
-
75
-
76
-
77
-
78
-
79
-
80
-
81
-
82
-
83
-
84
-
85
-
86
-
87
-
88
-
89
-
90
-
91
-
92
-
93
-
94
-
95
-
96
-
97
-
98
-
99
-
100
-
 101
101 -
 102
102 -
 103
103 -
 104
104 -
 105
105 -
 106
106 -
 107
107 -
 108
108 -
 109
109 -
 110
110 -
 111
111 -
 112
112 -
 113
113 -
 114
114 -
 115
115 -
 116
116 -
 117
117 -
 118
118 -
 119
119 -
 120
120 -
 121
121 -
122
-
123
-
124
-
125
-
126
-
127
-
128
-
129
-
130
-
131
-
132
-
133
-
134
-
135
-
136
-
137
-
138
-
139
-
140
-
141
-
142
-
143
-
144
-
145
-
146
-
147
-
148
-
149
-
150
-
151
-
152
-
153
-
154
-
155
-
156
-
157
-
158
-
159
-
160
-
161
-
162
-
163
-
164
-
165
-
166
-
167
-
168
-
169
-
170
-
171
-
172
-
173
-
174
-
175
-
176
-
177
-
178
-
179
-
180
-
181
 |
 |

HONEYWELL INTERNATIONAL INC.
NOTES TO FINANCIAL STATEMENTS—(Continued)
(Dollars in millions, except per share amounts)
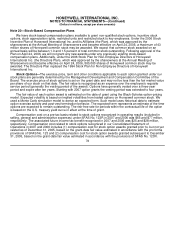
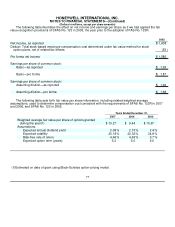
The following table illustrates the effect on net income and earnings per share as if we had applied the fair
value recognition provisions of SFAS No. 123 in 2005, the year prior to the adoption of FAS No. 123R.
2005
Net income, as reported $ 1,638
Deduct: Total stock-based employee compensation cost determined under fair value method for stock
option plans, net of related tax effects (53)
Pro forma net income $ 1,585
Earnings per share of common stock:
Basic—as reported $ 1.93
Basic—pro forma $ 1.87
Earnings per share of common stock:
Assuming dilution—as reported $ 1.92
Assuming dilution—pro forma $ 1.86
The following table sets forth fair value per share information, including related weighted-average
assumptions, used to determine compensation cost consistent with the requirements of SFAS No. 123R in 2007
and 2006, and SFAS No. 123 in 2005.
Years Ended December 31,
2007 2006 2005
Weighted average fair value per share of options granted
during the year(1) $ 10.27 $ 9.44 $ 10.67
Assumptions:
Expected annual dividend yield 2.09% 2.15% 2.4%
Expected volatility 20.18% 22.32% 34.8%
Risk-free rate of return 4.66% 4.63% 3.7%
Expected option term (years) 5.3 5.0 5.0
(1) Estimated on date of grant using Black-Scholes option-pricing model.
77