Honeywell 2007 Annual Report Download - page 68
Download and view the complete annual report
Please find page 68 of the 2007 Honeywell annual report below. You can navigate through the pages in the report by either clicking on the pages listed below, or by using the keyword search tool below to find specific information within the annual report.-
 1
1 -
2
-
3
-
4
-
5
-
6
-
7
-
8
-
9
-
10
-
11
-
12
-
13
-
14
-
15
-
16
-
17
-
18
-
19
-
20
-
21
-
22
-
23
-
24
-
25
-
26
-
27
-
28
-
29
-
30
-
31
-
32
-
33
-
34
-
35
-
36
-
37
-
38
-
39
-
40
-
41
-
42
-
43
-
44
-
45
-
46
-
47
-
48
-
49
-
50
-
51
-
52
-
53
-
54
-
55
-
56
-
57
-
 58
58 -
 59
59 -
 60
60 -
 61
61 -
 62
62 -
 63
63 -
 64
64 -
 65
65 -
 66
66 -
 67
67 -
 68
68 -
 69
69 -
 70
70 -
 71
71 -
 72
72 -
 73
73 -
 74
74 -
 75
75 -
 76
76 -
 77
77 -
 78
78 -
79
-
80
-
81
-
82
-
83
-
84
-
85
-
86
-
87
-
88
-
89
-
90
-
91
-
92
-
93
-
94
-
95
-
96
-
97
-
98
-
99
-
100
-
101
-
102
-
103
-
104
-
105
-
106
-
107
-
108
-
109
-
110
-
111
-
112
-
113
-
114
-
115
-
116
-
117
-
118
-
119
-
120
-
121
-
122
-
123
-
124
-
125
-
126
-
127
-
128
-
129
-
130
-
131
-
132
-
133
-
134
-
135
-
136
-
137
-
138
-
139
-
140
-
141
-
142
-
143
-
144
-
145
-
146
-
147
-
148
-
149
-
150
-
151
-
152
-
153
-
154
-
155
-
156
-
157
-
158
-
159
-
160
-
161
-
162
-
163
-
164
-
165
-
166
-
167
-
168
-
169
-
170
-
171
-
172
-
173
-
174
-
175
-
176
-
177
-
178
-
179
-
180
-
181
 |
 |

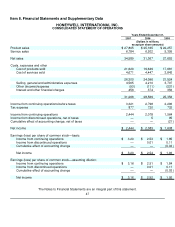
Item 8. Financial Statements and Supplementary Data
HONEYWELL INTERNATIONAL INC.
CONSOLIDATED STATEMENT OF OPERATIONS
Years Ended December 31,
2007 2006 2005
(Dollars in millions,
except per share amounts)
Product sales $ 27,805 $ 25,165 $ 22,257
Service sales 6,784 6,202 5,395
Net sales 34,589 31,367 27,652
Costs, expenses and other
Cost of products sold 21,629 19,649 17,681
Cost of services sold 4,671 4,447 3,843
26,300 24,096 21,524
Selling, general and administrative expenses 4,565 4,210 3,707
Other (income)/expense (53) (111) (231)
Interest and other financial charges 456 374 356
31,268 28,569 25,356
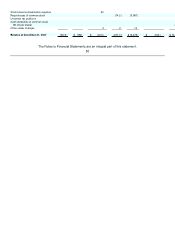
Income from continuing operations before taxes 3,321 2,798 2,296
Tax expense 877 720 732
Income from continuing operations 2,444 2,078 1,564
Income from discontinued operations, net of taxes — 5 95
Cumulative effect of accounting change, net of taxes — — (21)
Net income $ 2,444 $ 2,083 $ 1,638
Earnings (loss) per share of common stock—basic:
Income from continuing operations $ 3.20 $ 2.53 $ 1.85
Income from discontinued operations — 0.01 0.11
Cumulative effect of accounting change — — (0.03)
Net income $ 3.20 $ 2.54 $ 1.93
Earnings (loss) per share of common stock—assuming dilution:
Income from continuing operations $ 3.16 $ 2.51 $ 1.84
Income from discontinued operations — 0.01 0.11
Cumulative effect of accounting change — — (0.03)
Net income $ 3.16 $ 2.52 $ 1.92
The Notes to Financial Statements are an integral part of this statement.
47