HTC 2011 Annual Report Download - page 95
Download and view the complete annual report
Please find page 95 of the 2011 HTC annual report below. You can navigate through the pages in the report by either clicking on the pages listed below, or by using the keyword search tool below to find specific information within the annual report.-
 1
1 -
2
-
3
-
4
-
5
-
6
-
7
-
8
-
9
-
10
-
11
-
12
-
13
-
14
-
15
-
16
-
17
-
18
-
19
-
20
-
21
-
22
-
23
-
24
-
25
-
26
-
27
-
28
-
29
-
30
-
31
-
32
-
33
-
34
-
35
-
36
-
37
-
38
-
39
-
40
-
41
-
42
-
43
-
44
-
45
-
46
-
47
-
48
-
49
-
50
-
51
-
52
-
53
-
54
-
55
-
56
-
57
-
58
-
59
-
60
-
61
-
62
-
63
-
64
-
65
-
66
-
67
-
68
-
69
-
70
-
71
-
72
-
73
-
74
-
75
-
76
-
77
-
78
-
79
-
80
-
81
-
82
-
83
-
84
-
 85
85 -
 86
86 -
 87
87 -
 88
88 -
 89
89 -
 90
90 -
 91
91 -
 92
92 -
 93
93 -
 94
94 -
 95
95 -
 96
96 -
 97
97 -
 98
98 -
 99
99 -
 100
100 -
 101
101 -
 102
102 -
 103
103 -
 104
104 -
 105
105 -
106
-
107
-
108
-
109
-
110
-
111
-
112
-
113
-
114
-
115
 |
 |

2010 2011
NT$ NT$ US$ (Note 3)
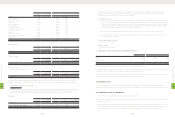
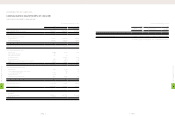
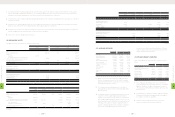
CASH FLOWS FROM FINANCING ACTIVITIES
Decrease in short-term borrowings $(42,326) $- $-
Decrease in long-term bank loans (22,499) (24,376) (805)
Increase in guarantee deposits received 12,749 28,987 958
Cash dividends (20,122,332) (29,891,089) (987,189)
Purchase of treasury stock (11,686,667) (16,135,808) (532,904)
Transfer of treasury stock to employees - 4,113,821 135,864
(Decrease) increase in minority interest (15,451) 669,472 22,109
Net cash used in financing activities (31,876,526) (41,238,993) (1,361,967)
EFFECT OF EXCHANGE RATE CHANGES ON CASH AND CASH EQUIVALENTS (538,359) (65,975) (2,180)
NET INCREASE IN CASH AND CASH EQUIVALENTS 9,824,571 13,038,647 430,616
CASH AND CASH EQUIVALENTS, BEGINNING OF YEAR 64,638,290 74,462,861 2,459,225
CASH AND CASH EQUIVALENTS, END OF YEAR $74,462,861 $87,501,508 $2,889,841
SUPPLEMENTAL CASH FLOW INFORMATION
Cash paid during the year
Interest $2,386 $32,197 $1,063
Income tax $4,448,828 $7,877,290 $260,157
NONCASH INVESTING AND FINANCING ACTIVITIES
Transfer of retained earnings to common stock $386,968 $403,934 $13,340
Transfer of assets leased to others to properties $47,813 $50,828 $1,679
Retirement of treasury stock $4,834,174 $8,509,336 $281,031
Transfer of stock bonuses to employees to common stock and additional paid-in capital $1,943,694 $4,245,851 $140,224
PURCHASE OF PROPERTIES AND ASSETS LEASED TO OTHERS
Purchase cost of properties and assets leased to others $5,278,345 $8,781,446 $290,017
Increase in payable for purchase of equipment (288,425) (370,264) (12,228)
Decrease in lease payable 1,076 - -
Cash paid for the purchase of properties and assets leased to others $4,990,996 $8,411,182 $277,789
ACQUISITION OF SUBSIDIARIES
Expected net cash outflow on the acquisition of subsidiaries $245,927 $20,303,485 $670,547
Increase in other payable (167,655) (92,756) (3,064)
Cash paid for acquisition of subsidiaries $78,272 $20,210,729 $667,483
(Concluded)
The accompanying notes are an integral part of the consolidated financial statements.
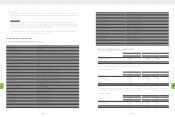
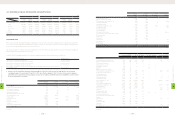
(In Thousands)
2010 2011
NT$ NT$ US$ (Note 3)
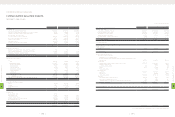
CASH FLOWS FROM OPERATING ACTIVITIES
Net income $39,514,844 $62,299,048 $2,057,501
Adjustments to reconcile net income to net cash provided by operating activities
Depreciation (including depreciation of assets leased to others) 905,138 1,564,225 51,660
Amortization 97,196 836,611 27,630
Compensation cost recognized for the transfer of treasury stock to employees - 1,788,270 59,060
Amortization of premium on financial assets 385 3,349 111
Prepaid pension cost (21,364) (24,878) (822)
Loss on equity-method investments - 3,961 131
Loss on disposal of properties and deferred charges, net 12,187 465 15
Transfer of properties to expenses 1,151 324 11
Gains on sale of investments, net (3,001) (29) (1)
Impairment losses on financial assets carried at cost and goodwill 32,771 18,608 615
Deferred income tax assets (1,537,739) (2,504,033) (82,699)
Net changes in operating assets and liabilities
Financial instruments at fair value through profit or loss (432,144) 229,037 7,564
Notes receivable - (755,450) (24,950)
Accounts receivable (34,472,524) (1,368,605) (45,200)
Inventories (20,435,168) (1,995,952) (65,919)
Prepayments 683,128 (4,402,607) (145,401)
Other current assets (582,339) (287,655) (9,500)
Other current financial assets (547,932) (622,371) (20,555)
Other assets - other (640,985) (6,012,050) (198,555)
Notes and accounts payable 37,129,824 15,167,466 500,924
Income tax payable 2,538,408 3,751,382 123,894
Accrued expenses 18,413,894 16,823,509 555,616
Other current liabilities 5,392,059 3,994,726 131,931
Net cash provided by operating activities 46,047,789 88,507,351 2,923,061
CASH FLOWS FROM INVESTING ACTIVITIES
Purchase of available-for-sale financial assets (3,551,180) (490,000) (16,183)
Proceeds of the sale of available-for-sale financial assets 5,610,175 200,029 6,606
Purchase of held-to-maturity financial assets (208,331) - -
Increase in financial assets carried at cost (286,876) (2,300,272) (75,969)
Acquisition of investments accounted for by the equity method - (76,214) (2,517)
Acquisition of subsidiaries (78,272) (20,210,729) (667,483)
Purchase of properties and assets leased to others (4,990,996) (8,411,182) (277,789)
Proceeds of the sale of properties and deferred charges 20,064 580 19
Increase in refundable deposits (21,817) (34,309) (1,133)
Increase in deferred charges (90,721) (574,267) (18,966)
Decrease in restricted assets 10,564 26,988 891
Increase in intangible assets (220,943) (2,294,360) (75,774)
Net cash used in investing activities (3,808,333) (34,163,736) (1,128,298)
HTC CORPORATION AND SUBSIDIARIES
CONSOLIDATED STATEMENTS OF CASH FLOWS
YEARS ENDED DECEMBER 31, 2010 AND 2011
(Continued)
8
FINANCIAL INFORMATION
| 186 |
8
FINANCIAL INFORMATION
| 187 |