HTC 2011 Annual Report Download - page 110
Download and view the complete annual report
Please find page 110 of the 2011 HTC annual report below. You can navigate through the pages in the report by either clicking on the pages listed below, or by using the keyword search tool below to find specific information within the annual report.-
 1
1 -
2
-
3
-
4
-
5
-
6
-
7
-
8
-
9
-
10
-
11
-
12
-
13
-
14
-
15
-
16
-
17
-
18
-
19
-
20
-
21
-
22
-
23
-
24
-
25
-
26
-
27
-
28
-
29
-
30
-
31
-
32
-
33
-
34
-
35
-
36
-
37
-
38
-
39
-
40
-
41
-
42
-
43
-
44
-
45
-
46
-
47
-
48
-
49
-
50
-
51
-
52
-
53
-
54
-
55
-
56
-
57
-
58
-
59
-
60
-
61
-
62
-
63
-
64
-
65
-
66
-
67
-
68
-
69
-
70
-
71
-
72
-
73
-
74
-
75
-
76
-
77
-
78
-
79
-
80
-
81
-
82
-
83
-
84
-
85
-
86
-
87
-
88
-
89
-
90
-
91
-
92
-
93
-
94
-
95
-
96
-
97
-
98
-
99
-
 100
100 -
 101
101 -
 102
102 -
 103
103 -
 104
104 -
 105
105 -
 106
106 -
 107
107 -
 108
108 -
 109
109 -
 110
110 -
 111
111 -
 112
112 -
 113
113 -
 114
114 -
 115
115
 |
 |

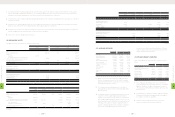
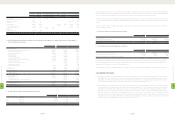
(32) SEGMENT DISCLOSURES
The Company is organized and managed as a single reportable business segment. The Company's operations are mainly related to the research,
design, manufacture and sales of smart handheld devices.
Selected financial information is as follows:
1. Geographical Areas
The Company's noncurrent assets (other than financial instruments, deferred income tax assets and post-employment benefit assets) located
in an individual foreign country as of December 31, 2010 and 2011 and revenues from domestic and overseas customers for 2010 and 2011 were
as follows:
Noncurrent Assets Revenues
Year Ended December 31 Year Ended December 31
2010 2011 2010 2011
NT$ NT$ US$ (Note 3) NT$ NT$ US$ (Note 3)
Taiwan $14,022,245 $24,807,110 $819,284 $7,557,197 $20,140,051 $665,149
Country W 140,125 10,271,855 339,240 137,860,891 215,842,904 7,128,469
Country X 638,003 2,021,707 66,769 23,333,440 30,969,172 1,022,794
Country Y 260 893 31 18,451,758 20,495,340 676,883
Country Z 2,425,839 5,240,612 173,077 5,050,102 21,866,615 722,171
Others 544,364 11,023,509 364,065 86,507,856 156,480,691 5,167,961
$17,770,836 $53,365,686 $1,762,466 $278,761,244 $465,794,773 $15,383,427
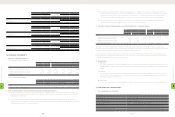
2. Major Customers
Revenues in 2010 and 2011 that were 10 percent or more from transactions with a single external customer were as follows:
2010 2011
Customer NT$ NT$ US$ (Note 3)
A $47,500,397 $75,243,879 $2,485,019
B 38,544,296 63,091,960 2,083,687
C 51,646,672 47,541,529 1,570,115
$137,691,365 $185,877,368 $6,138,821
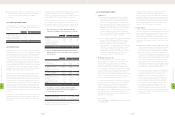
(33) DISCLOSURE OF THE PLAN FOR THE REQUIRED ADOPTION OF THE INTERNATIONAL FINANCIAL
REPORTING STANDARDS
Under Rule No. 0990004943 issued by the Financial Supervisory Commission (FSC) on February 2, 2010, the Company should disclose the
following information on its adoption of the International Financial Reporting Standards (IFRSs).
1. On May 14, 2009, the FSC announced the "Framework for the Adoption of International Financial Reporting Standards by the Companies
in the ROC." In this framework, starting 2013, companies with shares listed on the Taiwan Stock Exchange (TWSE) or traded on the Taiwan
GreTai Securities Market or Emerging Stock Market should prepare their financial statements in accordance with the Guidelines Governing the
Preparation of Financial Reports by Securities Issuers, the International Financial Reporting Standards, International Accounting Standards, and
the Interpretations as well as related guidances translated by the ARDF and issued by the FSC. To comply with this framework, the Company
has set up a project team and made a plan to adopt the IFRSs. Leading the implementation of this plan is Mr. James Chen, the vice president.
The main contents of the plan, schedule and status of execution as of December 31, 2011 were as follows:
Contents of Plan Responsible Department Status of Execution
1. Assessment phase: From January 1, 2010 to December 31, 2011
• Make a plan to adopt the IFRSs and set up a project team Finance and accounting Completed
• Conduct phase I internal training for employees Finance and accounting and talent
management Completed
• Compare and analyze the differences between the existing accounting policies and the
accounting policies to be adopted under IFRSs Finance and accounting Completed
(Continued)
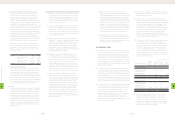
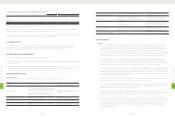
In November 2011, the Company acquired the business operation and ownership of patent portfolio of S3 Graphics Co., Ltd. ("S3 Graphics").
In July 2011, Apple filed another ITC investigation and a companion district court case in Delaware against the Company alleging patent
infringement (ITC No. 337-TA-797). In August 2011, the Company filed another ITC investigation and a companion district court case in
Delaware against Apple alleging patent infringement (ITC No. 337-TA-808) against Apple. On September 22, 2011, S3 Graphics filed another
ITC investigation (ITC No. 337-TA-813) and a companion district court case in Delaware against Apple alleging infringement of its patents.
In December 2011, the Company received the notice of ITC committee's final determination in the Apple vs. HTC case, (ITC No. 337-TA-710).
Apple originally asserted 10 of its patents against the Company in March 2010, and the ITC Committee ruled that the Company infringed
on 1 patent. Apple has appealed and the Company is implementing workaround into new products, so business is not affected in the
US. As for the investigation filed by the Company against Apple (ITC No. 337-TA-721), on October 17, 2011, the ITC judge issued his initial
determination and ruled that Apple does not infringe the 4 asserted patents owned by the Company. The Company has appealed.
As of February 14, 2012, the date of the accompanying independent auditors' report, there had been no critical hearing nor had a court
decision been made, except for the above.
(3) In March 2008, Flashpoint Technology, Inc., a U.S. entity, sued the Company with 10 patents in the District Court of Delaware alleging the
Company infringed its patents and seeking damage compensation. The Company filed re-exams and the district court case was stayed
pending the result of the re-examination from U.S. Patent and Trademark Office on November 2009, and is still stayed.
In May 2010, Flashpoint filed an ITC investigation against the Company with ITC alleging that the Company infringed its patents and
requested ITC to prevent the Company from importing to and selling devices in the United States. In November 2011, the ITC Committee
issued its Final Determination and ruled that the Company does not infringe patents owned by Flashpoint.
(4) The Company had shared lawsuit-related costs on the basis of common benefits and agreements between its vendors and customers. For
2011, companies that the Company shared lawsuit-related costs with included VIA Technologies Inc. and its subsidiaries.
(5) On the basis of its past experience and consultations with its legal counsel, the Company has evaluated the possible effects of the above
lawsuits on its business and financial condition as well as on relevant matters.
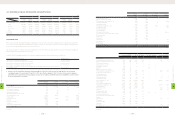
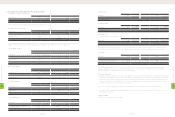
2. Construction of the Taipei R&D Headquarters
In September 2009, the Company's board of directors resolved to build the Taipei R&D headquarters in Xindian City and the land was bought from
Yulon Motors Ltd. The estimated budget for the construction is NT$3,380,000 thousand for a total floor space of 92 thousand square meters.
Construction is scheduled to be completed by February 2012 (Note 15 has more information).
3. Other
The significant financial assets and liabilities denominated in foreign currencies were as follows:
December 31
2010 2011
Foreign Currencies Exchange Rate Foreign Currencies Exchange Rate
Financial assets
Monetary items
USD $2,611,457 29.13 $3,143,462 30.28
EUR 744,761 38.92 498,383 39.19
GBP 95,774 45.19 54,254 46.73
RMB 698,286 4.42 1,344,825 4.77
Non-monetary items
USD 11,150 29.13 89,493 30.28
Investments accounted for by the equity method
USD - - 2,500 30.28
Financial liabilities
Monetary items
USD 2,929,408 29.13 3,372,400 30.28
EUR 756,858 38.92 583,741 39.19
GBP 112,468 45.19 53,624 46.73
RMB 383,542 4.42 1,463,205 4.77
8
FINANCIAL INFORMATION
| 216 |
8
FINANCIAL INFORMATION
| 217 |