HTC 2011 Annual Report Download - page 93
Download and view the complete annual report
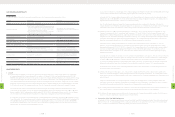
Please find page 93 of the 2011 HTC annual report below. You can navigate through the pages in the report by either clicking on the pages listed below, or by using the keyword search tool below to find specific information within the annual report.-
 1
1 -
2
-
3
-
4
-
5
-
6
-
7
-
8
-
9
-
10
-
11
-
12
-
13
-
14
-
15
-
16
-
17
-
18
-
19
-
20
-
21
-
22
-
23
-
24
-
25
-
26
-
27
-
28
-
29
-
30
-
31
-
32
-
33
-
34
-
35
-
36
-
37
-
38
-
39
-
40
-
41
-
42
-
43
-
44
-
45
-
46
-
47
-
48
-
49
-
50
-
51
-
52
-
53
-
54
-
55
-
56
-
57
-
58
-
59
-
60
-
61
-
62
-
63
-
64
-
65
-
66
-
67
-
68
-
69
-
70
-
71
-
72
-
73
-
74
-
75
-
76
-
77
-
78
-
79
-
80
-
81
-
82
-
 83
83 -
 84
84 -
 85
85 -
 86
86 -
 87
87 -
 88
88 -
 89
89 -
 90
90 -
 91
91 -
 92
92 -
 93
93 -
 94
94 -
 95
95 -
 96
96 -
 97
97 -
 98
98 -
 99
99 -
 100
100 -
 101
101 -
 102
102 -
 103
103 -
104
-
105
-
106
-
107
-
108
-
109
-
110
-
111
-
112
-
113
-
114
-
115
 |
 |

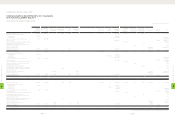
(In Thousands, Except Earnings Per Share)
2010 2011
Before
Income Tax
After
Income Tax Before Income Tax After
Income Tax
NT$ NT$ NT$ US$ (Note 3) NT$ US$ (Note 3)
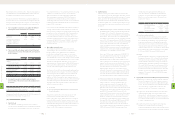
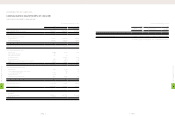
BASIC EARNINGS PER SHARE (Note 25) $51.98 $46.18 $82.63 $2.73 $73.32 $2.42
DILUTED EARNINGS PER SHARE (Note 25) $51.36 $45.64 $81.05 $2.68 $71.91 $2.37
The accompanying notes are an integral part of the consolidated financial statements.
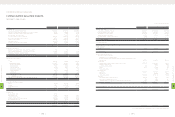
(In Thousands, Except Earnings Per Share)
2010 2011
NT$ NT$ US$ (Note 3)
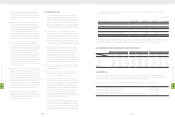
REVENUES (Notes 2 and 27) $278,761,244 $465,794,773 $15,383,427
COST OF REVENUES (Notes 2, 10, 23 and 27) 194,892,505 333,997,246 11,030,656
GROSS PROFIT 83,868,739 131,797,527 4,352,771
OPERATING EXPENSES (Notes 23 and 27)
Selling and marketing 21,757,601 40,422,905 1,335,014
General and administrative 5,038,543 6,626,010 218,832
Research and development 12,940,014 15,960,845 527,126
Total operating expenses 39,736,158 63,009,760 2,080,972
OPERATING INCOME 44,132,581 68,787,767 2,271,799
NONOPERATING INCOME AND GAINS
Interest income 313,888 701,724 23,175
Gain on disposal of properties 879 - -
Gains on sale of investments 3,001 29 1
Exchange gain (Note 2) - 1,520,643 50,221
Rental revenues (Note 27) 6,486 8,772 290
Valuation gains on financial instruments, net (Notes 2 and 6) 450,276 256,868 8,483
Other 368,414 295,228 9,750
Total nonoperating income and gains 1,142,944 2,783,264 91,920
NONOPERATING EXPENSES AND LOSSES
Interest expense 3,562 30,979 1,023
Loss on equity-method investments (Notes 2 and 14) - 3,961 131
Losses on disposal of properties 13,066 465 15
Exchange loss (Note 2) 214,679 - -
Impairment losses (Notes 2, 13 and 16) 32,771 18,608 615
Other 47,059 93,331 3,082
Total nonoperating expenses and losses 311,137 147,344 4,866
INCOME BEFORE INCOME TAX 44,964,388 71,423,687 2,358,853
INCOME TAX (Notes 2 and 24) (5,449,544) (9,124,639) (301,352)
NET INCOME $39,514,844 $62,299,048 $2,057,501
ATTRIBUTABLE TO
Stockholders of the parent $39,533,600 $61,975,796 $2,046,824
Minority interest (18,756) 323,252 10,677
$39,514,844 $62,299,048 $2,057,501
HTC CORPORATION AND SUBSIDIARIES
CONSOLIDATED STATEMENTS OF INCOME
YEARS ENDED DECEMBER 31, 2010 AND 2011
8
FINANCIAL INFORMATION
| 182 |
8
FINANCIAL INFORMATION
| 183 |