HTC 2011 Annual Report Download - page 77
Download and view the complete annual report
Please find page 77 of the 2011 HTC annual report below. You can navigate through the pages in the report by either clicking on the pages listed below, or by using the keyword search tool below to find specific information within the annual report.-
 1
1 -
2
-
3
-
4
-
5
-
6
-
7
-
8
-
9
-
10
-
11
-
12
-
13
-
14
-
15
-
16
-
17
-
18
-
19
-
20
-
21
-
22
-
23
-
24
-
25
-
26
-
27
-
28
-
29
-
30
-
31
-
32
-
33
-
34
-
35
-
36
-
37
-
38
-
39
-
40
-
41
-
42
-
43
-
44
-
45
-
46
-
47
-
48
-
49
-
50
-
51
-
52
-
53
-
54
-
55
-
56
-
57
-
58
-
59
-
60
-
61
-
62
-
63
-
64
-
65
-
66
-
 67
67 -
 68
68 -
 69
69 -
 70
70 -
 71
71 -
 72
72 -
 73
73 -
 74
74 -
 75
75 -
 76
76 -
 77
77 -
 78
78 -
 79
79 -
 80
80 -
 81
81 -
 82
82 -
 83
83 -
 84
84 -
 85
85 -
 86
86 -
 87
87 -
88
-
89
-
90
-
91
-
92
-
93
-
94
-
95
-
96
-
97
-
98
-
99
-
100
-
101
-
102
-
103
-
104
-
105
-
106
-
107
-
108
-
109
-
110
-
111
-
112
-
113
-
114
-
115
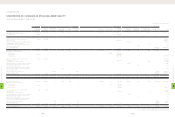
 |
 |

2010 2011
NT$ NT$ US$ (Note 3)
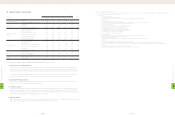
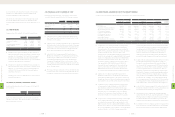
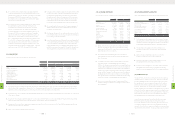
CASH FLOWS FROM FINANCING ACTIVITIES
Decrease in guarantee deposits received $(582) $- $-
Cash dividends (20,122,332) (29,891,089) (987,189)
Purchase of treasury stock (11,686,667) (16,135,808) (532,904)
Transfer treasury stock to employees - 4,113,821 135,864
Net cash used in financing activities (31,809,581) (41,913,076) (1,384,229)
NET INCREASE IN CASH AND CASH EQUIVALENTS 4,605,612 12,590,244 415,808
CASH AND CASH EQUIVALENTS, BEGINNING OF YEAR 61,676,464 66,282,076 2,189,044
CASH AND CASH EQUIVALENTS, END OF YEAR $66,282,076 $78,872,320 $2,604,852
SUPPLEMENTAL CASH FLOW INFORMATION
Cash paid during the year
Interest (net of amounts capitalized) $46 $10,265 $339
Income tax $4,161,335 $6,406,264 $211,574
NONCASH INVESTING AND FINANCING ACTIVITIES
Transfer of retained earnings to common stock $386,968 $403,934 $13,340
Transfer of assets leased to others to properties $47,813 $50,828 $1,679
Retirement of treasury stock $4,834,174 $8,509,336 $281,031
Transfer of stock bonuses to employees to common stock and additional paid-in capital $1,943,694 $4,245,851 $140,224
INCREASE IN LONG-TERM INVESTMENTS - EQUITY METHOD
Increase in investments accounted for by the equity method $2,976,349 $23,145,450 $764,406
Decrease in payable for purchase of investments 55,558 40,880 1,350
Cash paid for increase in long-term investments $3,031,907 $23,186,330 $765,756
PURCHASE OF PROPERTIES AND ASSETS LEASED TO OTHERS
Purchase cost of properties and assets leased to others $3,252,855 $5,359,120 $176,991
Increase in payable for purchase of equipment (249,681) (30,185) (997)
Decrease in lease payable 1,076 - -
Cash paid for the purchase of properties and assets leased to others $3,004,250 $5,328,935 $175,994
(Concluded)
The accompanying notes are an integral part of the financial statements.
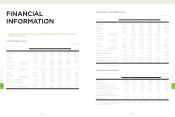
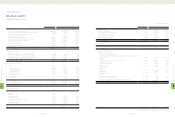
(In Thousands)
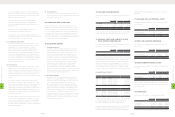
HTC CORPORATION
STATEMENTS OF CASH FLOWS
YEARS ENDED DECEMBER 31, 2010 AND 2011
2010 2011
NT$ NT$ US$ (Note 3)
CASH FLOWS FROM OPERATING ACTIVITIES
Net income $39,533,600 $61,975,796 $2,046,824
Adjustments to reconcile net income to net cash provided by operating activities
Depreciation (including depreciation of assets leased to others) 622,438 928,774 30,674
Amortization 58,621 397,022 13,112
Compensation cost recognized for the transfer of treasury stock to employees - 1,788,270 59,060
Distribution of bonuses to employees of subsidiaries (157,007) (599,510) (19,800)
Amortization of premium on financial assets 385 3,349 111
Prepaid pension costs (21,293) (24,882) (822)
Gains on equity-method investments (1,457,395) (2,718,362) (89,777)
Cash dividends received from equity-method investees 480 1,786 59
Loss on disposal of properties, net 139 - -
Transfer of properties to expenses 532 59 2
Gains on sale of investments, net (3,001) (29) (1)
Impairment loss on financial assets carried at cost 1,192 - -
Deferred income tax assets (1,467,669) (1,768,812) (58,417)
Net changes in operating assets and liabilities
Financial instruments at fair value through profit or loss (432,144) 193,408 6,388
Notes receivable - (755,450) (24,950)
Accounts receivable (9,852,810) 3,894,712 128,628
Accounts receivable from related parties (25,941,841) (4,790,878) (158,224)
Inventories (16,703,299) (3,468,828) (114,562)
Prepayments 1,003,874 (4,726,510) (156,099)
Other current assets (330,274) (101,225) (3,343)
Other current financial assets (483,435) (666,291) (22,005)
Other assets - other (640,985) (4,251,899) (140,424)
Notes and accounts payable 31,929,341 15,171,760 501,065
Accounts payable to related parties 1,261,305 2,292,250 75,704
Income tax payable 2,264,043 3,236,423 106,887
Accrued expenses 16,479,349 14,946,453 493,624
Other current liabilities 5,171,658 4,753,191 156,980
Net cash provided by operating activities 40,835,804 85,710,577 2,830,694
CASH FLOWS FROM INVESTING ACTIVITIES
Purchase of available-for-sale financial assets (3,551,180) (490,000) (16,183)
Proceeds of the sale of available-for-sale financial assets 5,610,175 200,029 6,606
Purchase of held-to-maturity financial assets (208,331) - -
Increase in investments accounted for by the equity method (3,031,907) (23,186,330) (765,756)
Purchase of properties and assets leased to others (3,004,250) (5,328,935) (175,994)
(Increase) decrease in refundable deposits (10,031) 303 10
Increase in deferred charges (4,144) (122,413) (4,043)
Increase in intangible assets (220,943) (2,279,911) (75,297)
Net cash used in investing activities (4,420,611) (31,207,257) (1,030,657)
(Continued)
8
FINANCIAL INFORMATION
| 150 |
8
FINANCIAL INFORMATION
| 151 |