HTC 2011 Annual Report Download - page 85
Download and view the complete annual report
Please find page 85 of the 2011 HTC annual report below. You can navigate through the pages in the report by either clicking on the pages listed below, or by using the keyword search tool below to find specific information within the annual report.-
 1
1 -
2
-
3
-
4
-
5
-
6
-
7
-
8
-
9
-
10
-
11
-
12
-
13
-
14
-
15
-
16
-
17
-
18
-
19
-
20
-
21
-
22
-
23
-
24
-
25
-
26
-
27
-
28
-
29
-
30
-
31
-
32
-
33
-
34
-
35
-
36
-
37
-
38
-
39
-
40
-
41
-
42
-
43
-
44
-
45
-
46
-
47
-
48
-
49
-
50
-
51
-
52
-
53
-
54
-
55
-
56
-
57
-
58
-
59
-
60
-
61
-
62
-
63
-
64
-
65
-
66
-
67
-
68
-
69
-
70
-
71
-
72
-
73
-
74
-
 75
75 -
 76
76 -
 77
77 -
 78
78 -
 79
79 -
 80
80 -
 81
81 -
 82
82 -
 83
83 -
 84
84 -
 85
85 -
 86
86 -
 87
87 -
 88
88 -
 89
89 -
 90
90 -
 91
91 -
 92
92 -
 93
93 -
 94
94 -
 95
95 -
96
-
97
-
98
-
99
-
100
-
101
-
102
-
103
-
104
-
105
-
106
-
107
-
108
-
109
-
110
-
111
-
112
-
113
-
114
-
115
 |
 |

2010 2011
NT$ NT$ US$ (Note 3)
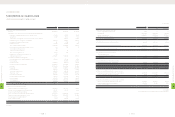
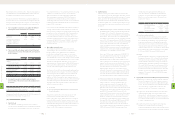
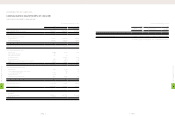
Unrealized sales allowance - 71,874 2,374
Other 131,570 102,064 3,371
Tax credit carryforwards 3,141,129 3,123,594 103,160
Total deferred tax assets 11,209,006 16,263,841 537,133
Less: Valuation allowance (7,760,428) (10,962,549) (362,052)
Total deferred tax assets, net 3,448,578 5,301,292 175,081
Deferred tax liabilities
Unrealized pension cost (27,021) (31,251) (1,032)
Unrealized valuation gains on financial instruments (76,547) (43,668) (1,442)
Other - (112,551) (3,717)
3,345,010 5,113,822 168,890
Less: Current portion (925,579) (1,517,302) (50,111)
Deferred tax assets - noncurrent $2,419,431 $3,596,520 $118,779
(Concluded)
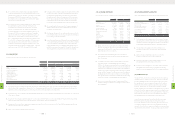
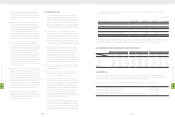
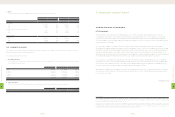
3. Details of the tax credit carryforwards were as follows:
2010 2011
Year of Occurrence Validity Period NT$ NT$ US$ (Note 3)
2012 2008-2012 $831,154 $813,302 $26,860
2013 2009-2013 2,309,975 2,310,286 76,300
2014 2010-2014 - 6 -
$3,141,129 $3,123,594 $103,160
Based on the Income Tax Law of the ROC, the investment and research and development tax credits can be carried forward for four years. The
total credits used in each year cannot exceed half of the estimated income tax provision, except in the last year.
Valuation allowance is based on management's evaluation of the amount of tax credits that can be carried forward for four years in line with the
Company's financial forecasts.
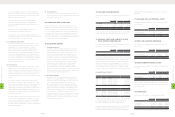
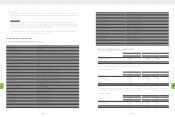
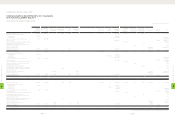
4. The income taxes in 2010 and 2011 were as follows:
2010 2011
NT$ NT$ US$ (Note 3)
Current income tax $6,330,018 $9,588,529 $316,672
Increase in deferred income tax assets (1,467,669) (1,768,812) (58,417)
Underestimation of prior year's income tax 95,360 54,158 1,789
Income tax $4,957,709 $7,873,875 $260,044
5. The integrated income tax information is as follows
2010 2011
NT$ NT$ US$ (Note 3)
Balance of imputation credit account (ICA) $3,098,652 $2,523,575 $83,344
Unappropriated earnings generated from 1998 52,876,892 75,762,315 2,502,141
Actual/estimated creditable ratio (including income tax payable) 17.73%
(Actual ratio)
15.91%
(Estimated ratio)
15.91%
(Estimated ratio)
For distribution of earnings generated on or after January 1, 1998, the ratio for the imputation credits allocated to stockholders of the Company
is based on the balance of the ICA as of the date of dividend distribution. The expected creditable ratio for the 2011 earnings may be adjusted,
depending on the ICA balance on the date of dividend distribution.
In the calculation of the expected creditable ratio for 2010 and 2011, the income taxes payable as of December 31, 2010 and 2011 were included.
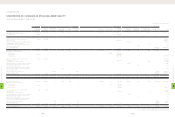
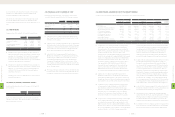
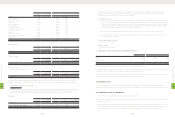
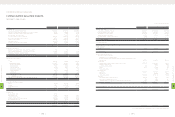
1. In May 2010, the Legislative Yuan passed the amendment of Article 5 of the Income Tax Law, which reduced a profit-
seeking enterprise's income tax rate from 20% to 17%, also effective January 1, 2010. Income taxes payable as of December
31, 2010 and 2011 were computed as follows:
2010 2011
NT$ NT$ US$ (Note 3)
Income before income tax $44,491,309 $69,849,671 $2,306,868
Gains on equity-method investments (1,457,395) (2,718,362) (89,777)
Impairment loss on financial assets carried at cost 1,192 - -
Realized investment loss (101,268) (40,986) (1,354)
Realized pension cost (21,293) (24,882) (822)
Unrealized losses on decline in value of inventory 789,930 1,194,497 39,450
Unrealized royalties 7,782,060 13,500,587 445,873
Realized exchange losses, net (156,772) (893,584) (29,512)
(Realized) unrealized bad-debt expenses (357,947) 523,546 17,291
Capitalized expense (49,924) 21,421 707
Unrealized warranty expense 3,769,488 3,698,214 122,138
Unrealized marketing expenses 7,169,890 9,824,170 324,455
(Unrealized) realized valuation gains on financial instruments (432,144) 193,408 $6,388
Unrealized contingent losses on purchase orders 1,216,443 110,734 3,657
Unrealized gains on intercompany transactions 237,305 806,075 26,622
Unrealized research materials expenses - 456,098 15,063
Unrealized sales allowance - 176,442 5,827
Unrealized (realized) salary expense 700,000 (700,000) (23,118)
Other (281,695) (89,782) (2,965)
Total income 63,299,179 95,887,267 3,166,791
Less: Tax-exempt income (56,137,044) (77,353,700) (2,554,698)
Taxable income 7,162,135 18,533,567 612,093
Tax rate 17% 17% 17%
Estimated income tax provision 1,217,563 3,150,706 104,056
Unappropriated earnings (additional 10% income tax) - 865,772 28,593
Less: Investment research and development tax credits (industrial Innovation Act) - (865,772) (28,593)
Income tax payable determined pursuant to the Income Tax Law $1,217,563 $3,150,706 $104,056
Alternative minimum tax $6,330,018 $9,588,529 $316,672
Less: Prepaid and withheld income tax (28,685) (61,661) (2,036)
Prior years' income tax payable 115,334 126,222 4,169
Income tax payable $6,416,667 $9,653,090 $318,805
The alternative minimum tax (AMT) imposed under the AMT Act is a supplemental tax levied at a rate of 10% which is payable if the income tax
payable determined pursuant to the Income Tax Law is below the minimum amount prescribed under the AMT Act. The taxable income for
calculating the AMT includes most of the income that is exempted from income tax under various laws and statutes. The Company has considered
the impact of the AMT Act in the determination of its tax liabilities. As a result, the current income tax payable as of December 31, 2010 and 2011
should be NT$6,330,018 thousand and NT$9,588,529 thousand (US$316,672 thousand), respectively.
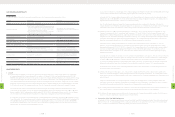
2. Deductible temporary differences and tax credit carryforwards that gave rise to deferred tax assets as of December 31,
2010 and 2011 were as follows:
2010 2011
NT$ NT$ US$ (Note 3)
Temporary differences
Allowance for loss on decline in value of inventory $584,238 $787,303 $26,002
Unrealized marketing expenses 2,676,285 4,344,683 143,488
Unrealized warranty expense 1,539,698 2,168,395 71,614
Capitalized expense 74,045 69,244 2,287
Unrealized royalties 2,522,645 4,817,745 159,112
Unrealized contingent losses on purchase orders 206,795 348,990 11,526
Unrealized bad-debt expenses 64,353 153,355 5,065
Unrealized exchange losses, net 268,248 138,092 4,560
Unrealized research materials - 138,502 4,574
(Continued)
8
FINANCIAL INFORMATION
| 166 |
8
FINANCIAL INFORMATION
| 167 |