HTC 2011 Annual Report Download - page 76
Download and view the complete annual report
Please find page 76 of the 2011 HTC annual report below. You can navigate through the pages in the report by either clicking on the pages listed below, or by using the keyword search tool below to find specific information within the annual report.-
 1
1 -
2
-
3
-
4
-
5
-
6
-
7
-
8
-
9
-
10
-
11
-
12
-
13
-
14
-
15
-
16
-
17
-
18
-
19
-
20
-
21
-
22
-
23
-
24
-
25
-
26
-
27
-
28
-
29
-
30
-
31
-
32
-
33
-
34
-
35
-
36
-
37
-
38
-
39
-
40
-
41
-
42
-
43
-
44
-
45
-
46
-
47
-
48
-
49
-
50
-
51
-
52
-
53
-
54
-
55
-
56
-
57
-
58
-
59
-
60
-
61
-
62
-
63
-
64
-
65
-
 66
66 -
 67
67 -
 68
68 -
 69
69 -
 70
70 -
 71
71 -
 72
72 -
 73
73 -
 74
74 -
 75
75 -
 76
76 -
 77
77 -
 78
78 -
 79
79 -
 80
80 -
 81
81 -
 82
82 -
 83
83 -
 84
84 -
 85
85 -
 86
86 -
87
-
88
-
89
-
90
-
91
-
92
-
93
-
94
-
95
-
96
-
97
-
98
-
99
-
100
-
101
-
102
-
103
-
104
-
105
-
106
-
107
-
108
-
109
-
110
-
111
-
112
-
113
-
114
-
115
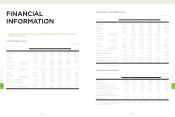
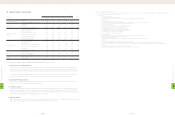
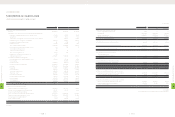
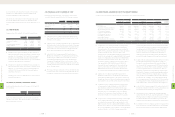
 |
 |

(In Thousands of New Taiwan Dollars)
HTC CORPORATION
STATEMENTS OF CHANGES IN STOCKHOLDERS' EQUITY
YEARS ENDED DECEMBER 31, 2010 AND 2011
Capital Stock Capital Surplus Retained Earnings Other Equity
Issued and
Outstanding
Common Stock
Issuance of
Shares in
Excess of Par
Treasury Stock
Transactions
Long-
term Equity
Investments
Merger Expired Stock
Options Legal Reserve Special Reserve Accumulated
Earnings
Cumulative
Translation
Adjustments
Net Loss Not
Recognized as
Pension Cost
Unrealized Valuation
Gain (Loss) on
Financial Instruments
Treasury Stock Total
BALANCE, JANUARY 1, 2010 $7,889,358 $9,056,323 $- $18,411 $25,189 $- $10,273,674 $- $38,364,099 $15,088 $(34) $(1,658) $- $65,640,450
Appropriation of the 2009 net earnings
Stock dividends 386,968 - - - - - - - (386,968) - - - - -
Cash dividends - - - - - - - - (20,122,332) - - - - (20,122,332)
Transfer of employee bonuses to common stock 50,206 1,893,488 - - - - - - - - - - - 1,943,694
Net income in 2010 - - - - - - - - 39,533,600 - - - - 39,533,600
Translation adjustments on long-term equity investments - - - - - - - - - (594,937) - - - (594,937)
Unrealized gain on financial instruments - - - - - - - - - - - 773 - 773
Adjustment due to the movement of investees' other
equity under the equity method - - - - - - - - - - (87) - - (87)
Purchase of treasury stock - - - - - - - - - - - - (11,686,667) (11,686,667)
Retirement of treasury stock (150,000) (172,188) - - (479) - - - (4,511,507) - - - 4,834,174 -
BALANCE, DECEMBER 31, 2010 8,176,532 10,777,623 - 18,411 24,710 - 10,273,674 - 52,876,892 (579,849) (121) (885) (6,852,493) 74,714,494
Appropriation of the 2010 net earnings
Special reserve - - - - - - - 580,856 (580,856) - - - - -
Stock dividends 403,934 - - - - - - - (403,934) - - - - -
Cash dividends - - - - - - - - (29,891,089) - - - - (29,891,089)
Transfer of employee bonuses to common stock 40,055 4,205,796 - - - - - - - - - - - 4,245,851
Net income in 2011 - - - - - - - - 61,975,796 - - - - 61,975,796
Unrealized gain on financial instruments - - - - - - - - - - - 3,824 - 3,824
Translation adjustments on long-term equity investments - - - - - - - - - 611,983 - - - 611,983
Adjustment due to the movement of investees' other
equity under the equity method - - - - - - - - - - (172) - - (172)
Adjustment due to changes in ownership percentage in
investees and the movement of investees' other equity
under the equity method
- - - (374) - - - - - - - - - (374)
Transfer of treasury stock to employees - - 1,750,767 - - 37,503 - - - - - - 4,113,821 5,902,091
Purchase of treasury stock - - - - - - - - - - - - (16,135,808) (16,135,808)
Retirement of treasury stock (100,000) (173,811) (20,309) - (287) (435) - - (8,214,494) - - - 8,509,336 -
BALANCE, DECEMBER 31, 2011 $8,520,521 $14,809,608 $1,730,458 $18,037 $24,423 $37,068 $10,273,674 $580,856 $75,762,315 $32,134 $(293) $2,939 $(10,365,144) $101,426,596
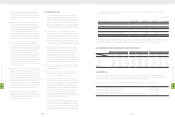
BALANCE, JANUARY 1, 2011 $270,040 $355,944 $- $608 $816 $- $339,300 $- $1,746,323 $(19,150) $(4) $(29) $(226,312) $2,467,536
Appropriation of the 2010 net earnings
Special reserve - - - - - - - 19,184 (19,184) - - - - -
Stock dividends 13,340 - - - - - - - (13,340) - - - - -
Cash dividends - - - - - - - - (987,189) - - - - (987,189)
Transfer of employee bonuses to common stock 1,323 138,901 - - - - - - - - - - - 140,224
Net income in 2011 - - - - - - - - 2,046,824 - - - - 2,046,824
Unrealized gain on financial instruments - - - - - - - - - - - 126 - 126
Translation adjustments on long-term equity investments - - - - - - - - - 20,211 - - - 20,211
Adjustment due to the movement of investees' other
equity under the equity method - - - - - - - - - - (6) - - (6)
Adjustment due to changes in ownership percentage of
investees' other equity under the equity method - - - (12) - - - - - - - - - (12)
Transfer of treasury stock to employees - - 57,821 - - 1,239 - - - - - - 135,864 194,924
Purchase of treasury stock - - - - - - - - - - - - (532,904) (532,904)
Retirement of treasury stock (3,303) (5,740) (671) - (9) (15) - - (271,293) - - - 281,031 -
BALANCE, DECEMBER 31, 2011 $281,400 $489,105 $57,150 $596 $807 $1,224 $339,300 $19,184 $2,502,141 $1,061 $(10) $97 $(342,321) $3,349,734
The accompanying notes are an integral part of the financial statements.
8
FINANCIAL INFORMATION
| 148 |
8
FINANCIAL INFORMATION
| 149 |