HTC 2011 Annual Report Download - page 81
Download and view the complete annual report
Please find page 81 of the 2011 HTC annual report below. You can navigate through the pages in the report by either clicking on the pages listed below, or by using the keyword search tool below to find specific information within the annual report.-
 1
1 -
2
-
3
-
4
-
5
-
6
-
7
-
8
-
9
-
10
-
11
-
12
-
13
-
14
-
15
-
16
-
17
-
18
-
19
-
20
-
21
-
22
-
23
-
24
-
25
-
26
-
27
-
28
-
29
-
30
-
31
-
32
-
33
-
34
-
35
-
36
-
37
-
38
-
39
-
40
-
41
-
42
-
43
-
44
-
45
-
46
-
47
-
48
-
49
-
50
-
51
-
52
-
53
-
54
-
55
-
56
-
57
-
58
-
59
-
60
-
61
-
62
-
63
-
64
-
65
-
66
-
67
-
68
-
69
-
70
-
 71
71 -
 72
72 -
 73
73 -
 74
74 -
 75
75 -
 76
76 -
 77
77 -
 78
78 -
 79
79 -
 80
80 -
 81
81 -
 82
82 -
 83
83 -
 84
84 -
 85
85 -
 86
86 -
 87
87 -
 88
88 -
 89
89 -
 90
90 -
 91
91 -
92
-
93
-
94
-
95
-
96
-
97
-
98
-
99
-
100
-
101
-
102
-
103
-
104
-
105
-
106
-
107
-
108
-
109
-
110
-
111
-
112
-
113
-
114
-
115
 |
 |

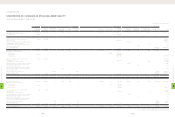
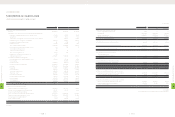
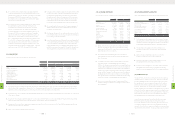
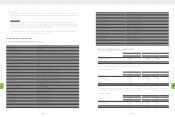
(14) INVESTMENTS ACCOUNTED FOR BY THE EQUITY METHOD
Investments accounted for by the equity method as of December 31, 2010 and 2011 were as follows:
2010 2011
Carrying Value Ownership
Percentage Original Cost Carrying Value Ownership
Percentage
NT$ NT$ US$ (Note 3) NT$ US$ (Note 3)
Equity method
H.T.C. (B.V.I.) Corp. $973,231 100.00 $2,395,492 $79,114 $2,728,368 $90,107 100.00
Communication Global Certification Inc. 399,496 100.00 380,000 12,550 463,905 15,321 100.00
High Tech Computer Asia Pacific Pte. Ltd. 7,685,469 100.00 18,274,127 603,525 23,140,506 764,243 100.00
HTC Investment Corporation 300,789 100.00 300,000 9,908 301,332 9,952 100.00
PT. High Tech Computer Indonesia 62 1.00 62 2 62 2 1.00
HTC I Investment Corporation $295,782 100.00 295,000 9,743 $295,902 9,773 100.00
HTC Holding Cooperatief U.A. 13 1.00 13 1 13 1 1.00
Huada Digital Corporation 245,568 100.00 250,000 8,256 250,689 8,279 50.00
HTC InvestmentOne (BVI) Corporation - - 9,309,121 307,444 9,296,786 307,037 100.00
Prepayments for long-term investments 83,665 579,485 19,138 579,485 19,138 -
$9,984,075 $31,783,300 $1,049,681 $37,057,048 $1,223,853
1.
In August 2000, the Company acquired 100% equity interest
in H.T.C. (B.V.I.) Corp. and accounted for this investment by
the equity method. The Company made a new investment of
NT$570,991 thousand and reorganized its overseas subsidiaries'
investment structure in 2010. Then, H.T.C. (B.V.I.) Corp.
transferred some of its subsidiaries to High Tech Computer Asia
Pacific Pte. Ltd. and reduced its capital by NT$893,506 thousand.
In 2011, the Company made a new investment of NT$1,696,821
thousand (US$56,040 thousand) in H.T.C. (B.V.I.) Corp. As of
December 31, 2011, the Company's investment in H.T.C. (B.V.I.)
Corp. amounted to NT$2,552,638 thousand (US$84,304
thousand). Because the registration of this investment had
not been completed as of December 31, 2011, an amount of
NT$157,146 thousand (US$5,190 thousand) was temporarily
accounted for under "prepayments for long-term investments."
2.
In April 2006, the Company acquired 92% equity interest in
BandRich Inc. for NT$135,000 thousand and accounted for this
investment by the equity method. In July 2010 the Company lost
its significant influence on this investee and has since accounted for
this investment by the cost method (Note 13 has more information).
3.
In January 2007, the Company acquired 100% equity interest
in Communication Global Certification Inc. for NT$280,000
thousand and accounted for this investment by the equity
method. The Company increased this investment by NT$100,000
thousand in 2010. As of December 31, 2011, the Company's
investment in Communication Global Certification Inc. had
amounted to NT$380,000 thousand (US$12,550 thousand).
4.
In July 2007, the Company acquired 100% equity interest in High
Tech Computer Asia Pacific Pte. Ltd. ("High Tech Asia") and
accounted for this investment by the equity method. In 2010,
High Tech Asia increased its capital by NT$3,198,864 thousand
because of the Company's new cash investment and a transfer-in
due to the reorganization of the Company's overseas subsidiaries'
investment structure. In 2011, the Company increased this
investment by NT$11,817,735 thousand (US$390,295 thousand).
As of December 31, 2011, the Company's investment in High Tech
Asia had amounted to NT$18,379,684 thousand (US$607,011
thousand). Because the registration of this investment had
not been completed as of December 31, 2011, an amount of
NT$105,557 thousand (US$3,486 thousand) was temporarily
accounted for under "prepayments for long-term investments.
5.
In April 2008, the Company made a bond investment of US$350
thousand and transferred its bond investment of US$1,000
thousand to convertible preferred stocks issued by Vitamin D
Inc. As a result, the Company acquired 27.27% equity interest in
Vitamin D Inc. for NT$40,986 thousand, enabling the Company
to exercise significant influence over this investee. Thus, the
Company accounted for this investment by the equity method.
After that, the Company's ownership percentage declined from
27.27% to 25.59%, and there was a capital surplus - long-term
equity investments of NT$1,689 thousand in 2008 and NT$671
thousand in 2009. In addition, the Company determined that
the recoverable amount of this investment in 2009 was less than
its carrying amount and thus recognized an impairment loss of
NT$30,944 thousand. Vitamin D was dissolved in August 2010.
6.
In July 2008, the Company acquired 100% equity interest in HTC
Investment Corporation for NT$300,000 thousand and has since
accounted for this investment by the equity method.
7.
In December 2007, the Company and its subsidiary, High Tech
Computer Asia Pacific Pte. Ltd., acquired equity interests of 1% and
99%, respectively, in PT. High Tech Computer Indonesia for NT$62
thousand and NT$6,122 thousand, respectively. As a result, the
Company has accounted for this investment by the equity method.
8.
In September 2009, the Company acquired 100% equity interest
in HTC I Investment Corporation for NT$295,000 thousand and
has since accounted for this investment by the equity method.
As of December 31, 2010 and 2011, the allowances for inventory
devaluation were NT$3,436,697 thousand and NT$4,631,195
thousand (US$152,951 thousand), respectively.
The write-down of inventories to their net realizable value, which
amounted to NT$1,297,811 thousand in 2010 and NT$3,197,362
thousand (US$105,597 thousand) in 2011, was recognized as cost of
sales.
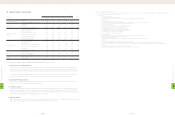
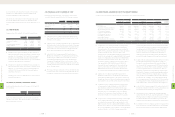
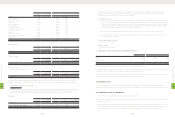
(11) PREPAYMENTS
Prepayments as of December 31, 2010 and 2011 were as follows:
2010 2011
NT$ NT$ US$ (Note 3)
Royalty $1,837,341 $4,802,446 $158,607
Prepayments to suppliers 1,302 1,198,886 39,594
Services 166,781 548,480 18,114
Software and hardware maintenance
94,871 263,211 8,693
Molding equipment 91,058 188,242 6,217
Others 123,224 39,822 1,315
$2,314,577 $7,041,087 $232,540
1. Prepayments for royalty were primarily for discount purposes
and were classified as current or noncurrent on the basis of their
maturities. As of December 31, 2010 and 2011, the noncurrent
prepayments of NT$2,484,156 thousand and NT$4,728,895
thousand (US$156,177 thousand), respectively, were classified as
other assets (Note 28 has more information).
2.
Prepayments to suppliers were primarily for discount purposes
and were classified as current or noncurrent on the basis of their
maturities. As of December 31, 2011, noncurrent prepayments
of NT$2,007,160 thousand (US$66,289 thousand) had been
classified as other assets.
Prepayments for others were primarily for rent, travel, insurance
and marketing expenses.
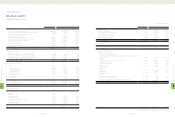
(12) HELD-TO-MATURITY FINANCIAL ASSETS
Held-to-maturity financial assets as of December 31, 2010 and 2011
were as follows:
2010 2011
NT$ NT$ US$ (Note 3)
Corporate bonds $207,946 $204,597 $6,757
In 2010, the Company bought the corporate bonds issued by Nan
Ya Plastics Corporation. These bonds will mature in 2013 and has an
effective interest rate of 0.90%.
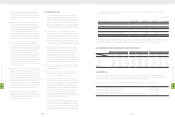
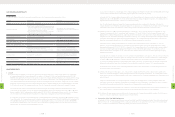
(13) FINANCIAL ASSETS CARRIED AT COST
Financial assets carried at cost as of December 31, 2010 and 2011
consisted of domestic unquoted stocks of the following companies:
2010 2011
NT$ NT$ US$ (Note 3)
Hua-Chuang Automobile Information
Technical Center Co., Ltd.
$500,000 $500,000 $16,513
BandRich Inc. 15,861 15,861 524
Answer Online, Inc. 1,192 1,192 39
517,053 517,053 17,076
Less: Accumulated impairment loss
(1,192) (1,192) (39)
$515,861 $515,861 $17,037
1.
In January 2007, the Company acquired 10% equity interest in
Hua-Chuang Automobile Information Technical Center Co., Ltd.
for NT$500,000 thousand.
2.
In March 2004, the Company merged with IA Style, Inc. and acquired
1.82% equity interest in Answer Online, Inc. as a result of the merger.
In addition, the Company determined that the recoverable amount
of this investment in 2010 was less than its carrying amount and
thus recognized an impairment loss of NT$1,192 thousand.
3.
In April 2006, the Company acquired 92% equity interest in
BandRich Inc. for NT$135,000 thousand and accounted for this
investment by the equity method. After that, the Company's
ownership percentage declined from 92% to 18.08% and the
Company lost its significant influence on this investee. When
the Company's ownership percentage changed in July 2010, the
Company transferred this investment to "financial assets carried
at cost" using book value.
4.
These unquoted equity instruments were not carried at fair value
because their fair value could not be reliably measured; thus, the
Company accounted for these investments by the cost method.
8
FINANCIAL INFORMATION
| 158 |
8
FINANCIAL INFORMATION
| 159 |