HTC 2011 Annual Report Download - page 86
Download and view the complete annual report
Please find page 86 of the 2011 HTC annual report below. You can navigate through the pages in the report by either clicking on the pages listed below, or by using the keyword search tool below to find specific information within the annual report.-
 1
1 -
2
-
3
-
4
-
5
-
6
-
7
-
8
-
9
-
10
-
11
-
12
-
13
-
14
-
15
-
16
-
17
-
18
-
19
-
20
-
21
-
22
-
23
-
24
-
25
-
26
-
27
-
28
-
29
-
30
-
31
-
32
-
33
-
34
-
35
-
36
-
37
-
38
-
39
-
40
-
41
-
42
-
43
-
44
-
45
-
46
-
47
-
48
-
49
-
50
-
51
-
52
-
53
-
54
-
55
-
56
-
57
-
58
-
59
-
60
-
61
-
62
-
63
-
64
-
65
-
66
-
67
-
68
-
69
-
70
-
71
-
72
-
73
-
74
-
75
-
 76
76 -
 77
77 -
 78
78 -
 79
79 -
 80
80 -
 81
81 -
 82
82 -
 83
83 -
 84
84 -
 85
85 -
 86
86 -
 87
87 -
 88
88 -
 89
89 -
 90
90 -
 91
91 -
 92
92 -
 93
93 -
 94
94 -
 95
95 -
 96
96 -
97
-
98
-
99
-
100
-
101
-
102
-
103
-
104
-
105
-
106
-
107
-
108
-
109
-
110
-
111
-
112
-
113
-
114
-
115
 |
 |

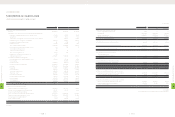
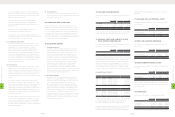
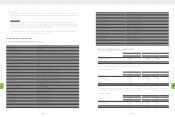
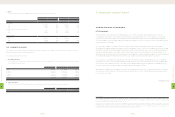
(2) Derivative financial instruments
December 31
2010 2011
Carrying Amount Fair Value Carrying Amount Fair Value
NT$ NT$ NT$ US$ (Note 3) NT$ US$ (Note 3)
Assets
Financial assets at fair value through profit or loss - current $450,276 $450,276 $256,868 $8,483 $256,868 $8,483
2. Methods and Assumptions Used in Determining Fair Values of Financial Instruments
(1) Not subject to Statement of Financial Accounting Standards No. 34 - "Financial Instruments: Recognition and Measurement" are cash,
receivables, other current financial assets, payables, accrued expenses and other current financial liabilities, which have carrying amounts
that approximate their fair values.
(2) The financial instruments exclude refundable deposits and guarantee deposits. The fair values of refundable deposits and guarantee
deposits received are based on the present value of future cash flows discounted at the average interest rates for time deposits with
maturities similar to those of the financial instruments.
(3) The fair values of financial instruments at fair value through profit or loss, available-for-sale and held-to-maturity financial assets are based
on quoted market prices in an active market, and their fair values can be reliably measured. If the securities do not have market prices, fair
value is measured on the basis of financial or other information. The Company uses estimates and assumptions that are consistent with
information that market participants would use in setting a price for these securities with no quoted market prices.
(4) Financial assets carried at cost are investments in unquoted shares, which have no quoted prices in an active market and entail an
unreasonably high cost to obtain verifiable fair values. Therefore, no fair value is presented.
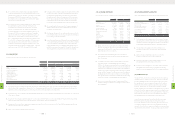
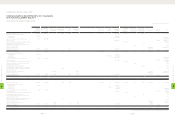
3. Fair Values of Financial Instruments Based on Quoted Market Prices or Valuation Methods
Fair Values Based on Quoted Market Prices Fair Values Based on Valuation Methods
December 31 December 31
2010 2011 2010 2011
NT$ NT$ US$ (Note 3) NT$ NT$ US$ (Note 3)
Assets
Financial assets at fair value through profit or loss - current $- $- $- $450,276 $256,868 $8,483
Available-for-sale financial assets - current 441,948 736,031 24,308 - - -
Available-for-sale financial assets - noncurrent 538 279 9 - - -
Held-to-maturity financial assets - noncurrent 207,467 203,783 6,730 - - -
Financial assets carried at cost - - - 515,861 515,861 17,037
There was no loss or gain recognized for 2010 and 2011 on the fair value changes of derivatives with fair values estimated using valuation
techniques. However, the Company recognized unrealized gains of NT$773 thousand for 2010 and NT$3,824 thousand (US$126 thousand) for 2011
under stockholders' equity for the changes in fair value of available-for-sale financial assets.
As of December 31, 2010 and 2011, financial assets exposed to fair value interest rate risk amounted to NT$207,946 thousand and NT$204,597
thousand (US$6,757 thousand), respectively; financial assets exposed to cash flow interest rate risk amounted to NT$50,853,665 thousand and
NT$57,082,965 thousand (US$1,885,232 thousand), respectively.
4. Financial Risks
(1) Market risk
The Company uses derivative contracts for hedging purposes, i.e., to reduce any adverse effect of exchange rate fluctuations of accounts
receivable/payable. The gains or losses on these contracts almost offset the gains or losses on the hedged items. Thus, market risk is not material.
(2) Credit risk
The Company deals only with banks with good credit standing based on the banks' reputation and takes into account past experience
with them. Moreover, the Company has a series of control procedures for derivative transactions. Management believes its exposure to
counter-parties' default on contracts is low.
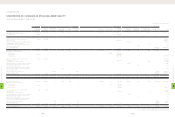
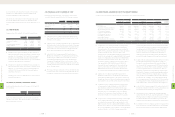
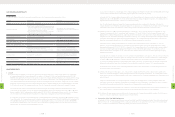
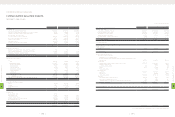
(23) EARNINGS PER SHARE
Earnings per share (EPS) before tax and after tax are calculated by dividing net income by the weighted average number of common shares
outstanding, which includes the deduction of the effect of treasury stock during each year. The weighted average number of shares used in EPS
calculation was 856,001 thousand shares for 2010 and 845,319 thousand shares for 2011. EPS for 2010 was calculated after the average number of
shares outstanding was adjusted retroactively for the effect of stock dividend distribution in 2011.
The Accounting Research and Development Foundation issued Interpretation 2007-052, which requires companies to recognize bonuses paid
to employees, directors and supervisors as compensation expenses beginning January 1, 2008. These bonuses were previously recorded as
appropriations from earnings. If the Company may settle the bonus to employees by cash or shares, the Company should presume that the entire
amount of the bonus will be settled in shares and the resulting potential shares should be included in the weighted average number of shares
outstanding used in the calculation of diluted EPS, if the shares have a dilutive effect. The number of shares is estimated by dividing the entire
amount of the bonus by the closing price of the shares at the balance sheet date. Such dilutive effects of the potential shares needs to be included
in the calculation of diluted EPS until the stockholders resolve the number of shares to be distributed to employees at their meeting in the following
year. The related EPS information for 2010 and 2011 is as follows:
2010
Amount (Numerator) Shares
(Denominator)
(In Thousands)
EPS (In Dollars)
Before Income Tax After Income Tax Before Income Tax After Income Tax
NT$ NT$ NT$ NT$
Basic EPS $44,491,309 $39,533,600 856,001 $51.98 $46.18
Bonus to employees - - 10,201
Diluted EPS $44,491,309 $39,533,600 866,202 $51.36 $45.64
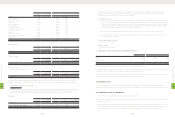
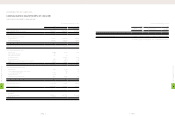
2011
Amount (Numerator) Shares
(Denominator)
(In Thousands)
EPS (In Dollars)
Before Income Tax After Income Tax Before Income Tax After Income Tax
NT$ NT$ NT$ NT$
Basic EPS $69,849,671 $61,975,796 845,319 $82.63 $73.32
Bonus to employees - - 16,527
Diluted EPS $69,849,671 $61,975,796 861,846 $81.05 $71.91
2011
Amount (Numerator) Shares
(Denominator)
(In Thousands)
EPS (In Dollars)
Before Income Tax After Income Tax Before Income Tax After Income Tax
US$ (Note 3) US$ (Note 3) US$ (Note 3) US$ (Note 3)
Basic EPS $2,306,868 $2,046,824 845,319 $2.73 $2.42
Bonus to employees - - 16,527
Diluted EPS $2,306,868 $2,046,824 861,846 $2.68 $2.37
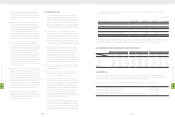
(24) FINANCIAL INSTRUMENTS
1. Fair Value of Financial Instruments
(1) Nonderivative financial instruments
December 31
2010 2011
Carrying Amount Fair Value Carrying Amount Fair Value
NT$ NT$ NT$ US$ (Note 3) NT$ US$ (Note 3)
Assets
Available-for-sale financial assets - current $441,948 $441,948 $736,031 $24,308 $736,031 $24,308
Available-for-sale financial assets - noncurrent 538 538 279 9 279 9
Held-to-maturity financial assets - noncurrent 207,946 207,467 204,597 6,757 203,783 6,730
Financial assets carried at cost 515,861 515,861 515,861 17,037 515,861 17,037
8
FINANCIAL INFORMATION
| 168 |
8
FINANCIAL INFORMATION
| 169 |