HTC 2011 Annual Report Download - page 70
Download and view the complete annual report
Please find page 70 of the 2011 HTC annual report below. You can navigate through the pages in the report by either clicking on the pages listed below, or by using the keyword search tool below to find specific information within the annual report.-
 1
1 -
2
-
3
-
4
-
5
-
6
-
7
-
8
-
9
-
10
-
11
-
12
-
13
-
14
-
15
-
16
-
17
-
18
-
19
-
20
-
21
-
22
-
23
-
24
-
25
-
26
-
27
-
28
-
29
-
30
-
31
-
32
-
33
-
34
-
35
-
36
-
37
-
38
-
39
-
40
-
41
-
42
-
43
-
44
-
45
-
46
-
47
-
48
-
49
-
50
-
51
-
52
-
53
-
54
-
55
-
56
-
57
-
58
-
59
-
 60
60 -
 61
61 -
 62
62 -
 63
63 -
 64
64 -
 65
65 -
 66
66 -
 67
67 -
 68
68 -
 69
69 -
 70
70 -
 71
71 -
 72
72 -
 73
73 -
 74
74 -
 75
75 -
 76
76 -
 77
77 -
 78
78 -
 79
79 -
 80
80 -
81
-
82
-
83
-
84
-
85
-
86
-
87
-
88
-
89
-
90
-
91
-
92
-
93
-
94
-
95
-
96
-
97
-
98
-
99
-
100
-
101
-
102
-
103
-
104
-
105
-
106
-
107
-
108
-
109
-
110
-
111
-
112
-
113
-
114
-
115
 |
 |

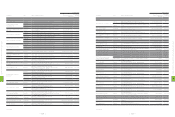
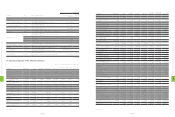
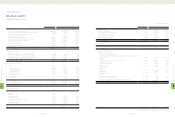
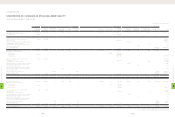
(2) Abbreviated Consolidated Balance Sheets
Unit:NT$ thousands
Item
Year
As of 2012.3.31
2011 2010 2009 2008 2007
Current Assets 193,427,606 168,606,486 104,867,841 104,223,660 85,763,011 171,001,721
Long-term Investments 3,685,262 1,232,145 810,485 541,437 501,976 4,178,800
Properties 21,512,478 14,024,329 9,899,808 8,916,350 4,220,962 22,471,729
Intangible Assets 22,560,788 935,650 240,482 289,783 175,206 21,947,552
Other Assets 13,405,992 5,583,134 3,610,401 1,771,180 755,326 14,742,261
Total Assets 254,592,126 190,381,744 119,429,017 115,742,410 91,416,481 234,342,063
Current Liabilities Before Appropriation 152,129,860 115,641,103 53,728,775 54,998,933 35,152,925 131,641,134
After Appropriation * 145,532,192 73,851,107 75,124,567 55,849,472 *
Long-term Liabilities - 12,188 24,375 46,875 75,625 -
Other Liabilities 42,946 13,959 1,210 6,420 633 43,014
Total Liabilities Before Appropriation 152,172,806 115,667,250 53,754,360 55,052,228 35,229,183 131,684,148
After Appropriation * 145,558,339 73,876,692 75,177,862 55,925,730 *
Capital stock 8,520,521 8,176,532 7,889,358 7,553,938 5,731,337 8,520,521
Capital surplus 16,619,594 10,820,744 9,099,923 4,417,534 4,415,845 16,619,594
Retained Earnings Before Appropriation 86,616,845 63,150,566 48,637,773 52,036,321 45,920,120 91,084,037
After Appropriation * 32,855,543 28,128,473 31,537,990 23,400,972 *
Unrealized Loss On Financial Instruments 2,939 (885) (1,658) (1,632) (1,187) 117,091
Cumulative Translation Adjustments 32,134 (579,849) 15,088 65,602 9,664 (664,130)
Net Loss Not Recognized As Pension Cost (293) (121) (34) - - (293)
Treasury Stock (10,365,144) (6,852,493) - (3,410,277) - (14,065,490)
Equity Attribute To The Stockholders Of The Parent 101,426,596 74,714,494 65,640,450 60,661,486 56,075,779 101,611,330
Minority Interest 992,724 - 34,207 28,696 111,519 1,046,585
Total Stockholders' Equity Before Appropriation 102,419,320 74,714,494 65,674,657 60,690,182 56,187,298 102,657,915
After Appropriation * 44,823,405 45,552,325 40,564,548 35,490,751 *
*Subject to change after shareholders' meeting resolution
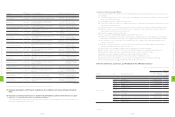
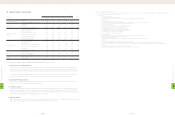
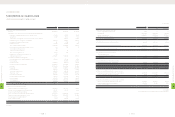
(3) Abbreviated Income Statements
NT$ thousands (Except EPS:NT$)
Item Year 2012 1Q
2011 2010 2009 2008 2007(Note 2)
Revenues 455,079,186 275,046,954 144,880,715 152,558,766 118,579,958 64,957,334
Gross Profit (Note 1) 119,754,046 79,556,972 45,862,483 50,641,854 40,177,500 13,867,283
Operating Income (Note 1) 64,860,542 42,295,343 24,174,994 30,256,385 30,535,537 4,312,756
Non-operating Income and Gains (Note 1) 5,060,293 2,536,080 1,623,362 2,300,018 1,810,908 825,010
Non-operating Expenses and Losses (Note 1) 71,164 340,114 585,892 965,924 195,148 239,949
Income from Continuing Operations before Income Tax 69,849,671 44,491,309 25,212,464 31,590,479 32,151,297 4,897,817
Income from Continuing Operations 61,975,796 39,533,600 22,608,902 28,635,349 28,938,862 4,467,192
Income (Loss) from Discontinued Operations - - - - - -
Income (Loss) from Extraordinary Items - - - - - -
Cumulative Effect of Changes in Accounting Principle ------
Net Income 61,975,796 39,533,600 22,608,902 28,635,349 28,938,862 4,467,192
Basic Earnings Per Share 73.32 46.18 26.04 32.80 33.09 5.35
Note 1: In accordance with 2008 and 2011 financial reporting requirements, write-downs of inventories or reversal of write-downs and product warranty costs registered in 2007 have
been reclassified as cost of revenues items.
Note 2: Excluded employee bonus expenses
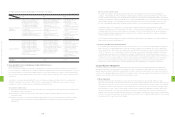
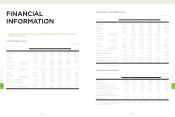
FINANCIAL
INFORMATION
1. Abbreviated Balance Sheets And Income Statements For The Past
Five Fiscal Years
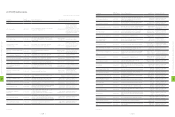
(1) Abbreviated Balance Sheets
Unit:NT$ thousands
Item
Year As of
2012.3.31
2011 2010 2009 2008 2007
Current Assets 180,772,179 156,875,067 101,470,633 101,238,950 83,172,719 156,832,034
Long-term Investments 37,777,785 10,708,420 6,506,194 5,160,891 2,899,109 40,820,220
Properties 15,422,345 10,941,230 8,314,177 7,375,651 3,715,901 16,437,339
Intangible Assets 2,120,948 208,581 - - - 1,997,046
Other Assets 10,812,829 5,317,155 3,330,938 1,450,870 656,817 12,134,207
Total Assets 246,906,086 184,050,453 119,621,942 115,226,362 90,444,546 228,220,846
Current Liabilities Before Appropriation 145,478,862 109,335,331 53,980,282 54,558,470 34,368,139 126,608,918
After Appropriation * 139,226,420 74,102,614 74,684,104 55,064,686 *
Long-term Liabilities - - - - - -
Other Liabilities 628 628 1,210 6,406 628 598
Total Liabilities Before Appropriation 145,479,490 109,335,959 53,981,492 54,564,876 34,368,767 126,609,516
After Appropriation * 139,227,048 74,103,824 74,690,510 55,065,314 *
Capital stock 8,520,521 8,176,532 7,889,358 7,553,938 5,731,337 8,520,521
Capital surplus 16,619,594 10,820,744 9,099,923 4,417,534 4,415,845 16,619,594
Retained Earnings Before Appropriation 86,616,845 63,150,566 48,637,773 52,036,321 45,920,120 91,084,037
After Appropriation * 32,855,543 28,128,473 31,537,990 23,400,972 *
Unrealized Loss On Financial Instruments 2,939 (885) (1,658) (1,632) (1,187) 117,091
Cumulative Translation Adjustments 32,134 (579,849) 15,088 65,602 9,664 (664,130)
Net Loss Not Recognized As Pension Cost (293) (121) (34) - - (293)
Treasury Stock (10,365,144) (6,852,493) - (3,410,277) - (14,065,490)
Total Stockholders' Equity Before Appropriation 101,426,596 74,714,494 65,640,450 60,661,486 56,075,779 101,611,330
After Appropriation * 44,823,405 45,518,118 40,535,852 35,379,232 *
*Subject to change after shareholders' meeting resolution
8
FINANCIAL INFORMATION
| 136 |
8
FINANCIAL INFORMATION
| 137 |