HTC 2011 Annual Report Download - page 106
Download and view the complete annual report
Please find page 106 of the 2011 HTC annual report below. You can navigate through the pages in the report by either clicking on the pages listed below, or by using the keyword search tool below to find specific information within the annual report.-
 1
1 -
2
-
3
-
4
-
5
-
6
-
7
-
8
-
9
-
10
-
11
-
12
-
13
-
14
-
15
-
16
-
17
-
18
-
19
-
20
-
21
-
22
-
23
-
24
-
25
-
26
-
27
-
28
-
29
-
30
-
31
-
32
-
33
-
34
-
35
-
36
-
37
-
38
-
39
-
40
-
41
-
42
-
43
-
44
-
45
-
46
-
47
-
48
-
49
-
50
-
51
-
52
-
53
-
54
-
55
-
56
-
57
-
58
-
59
-
60
-
61
-
62
-
63
-
64
-
65
-
66
-
67
-
68
-
69
-
70
-
71
-
72
-
73
-
74
-
75
-
76
-
77
-
78
-
79
-
80
-
81
-
82
-
83
-
84
-
85
-
86
-
87
-
88
-
89
-
90
-
91
-
92
-
93
-
94
-
95
-
 96
96 -
 97
97 -
 98
98 -
 99
99 -
 100
100 -
 101
101 -
 102
102 -
 103
103 -
 104
104 -
 105
105 -
 106
106 -
 107
107 -
 108
108 -
 109
109 -
 110
110 -
 111
111 -
 112
112 -
 113
113 -
 114
114 -
 115
115
 |
 |

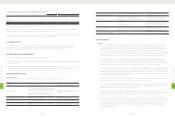
As of December 31, 2010 and 2011, the loss carryforwards of HTC BRASIL that gave rise to deferred income tax assets in the Federative Republic of
Brazil were NT$1,523 thousand and NT$1,411 thousand (US$47 thousand), respectively. Taxation could be made on its net income after deduction
of losses incurred in the preceding years, but the deduction cannot exceed 30% of the taxable income of the current year.
As of December 31, 2011, the loss carryforwards of Saffron Digital Inc. and Dashwire, Inc. that gave rise to deferred income tax assets in the United
States were NT$4,330 thousand (US$143 thousand) and NT$84,630 thousand (US$2,795 thousand), respectively, and could be carried forward for
20 years.
Valuation allowance is based on management's evaluation of the amount of tax credits that can be carried forward for four years in line with the
Company's financial forecasts.
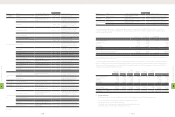
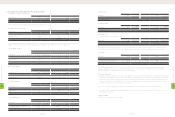
4. The income taxes in 2010 and 2011 were as follows:
2010 2011
NT$ NT$ US$ (Note 3)
Current income tax $6,890,038 $11,581,019 $382,477
Increase in deferred income tax assets (1,537,739) (2,504,033) (82,699)
Underestimation of prior year's income tax 97,245 47,653 1,574
Income tax $5,449,544 $9,124,639 $301,352
5. The integrated income tax information is as follows:
2010 2011
NT$ NT$ US$ (Note 3)
Balance of imputation credit account (ICA) $3,098,652 $2,523,575 $83,344
Unappropriated earnings generated from 1998 52,876,892 75,762,315 2,502,141
Actual/estimated creditable ratio (including income tax payable) 17.73%
(Actual ratio)
15.91%
(Estimated ratio)
15.91%
(Estimated ratio)
For distribution of earnings generated on or after January 1, 1998, the ratio for the imputation credits allocated to stockholders of the Company
is based on the balance of the ICA as of the date of dividend distribution. The expected creditable ratio for the 2011 earnings may be adjusted,
depending on the ICA balance on the date of dividend distribution.
In the calculation of the expected creditable ratio for 2010 and 2011, the income taxes payable as of December 31, 2010 and 2011 were included.
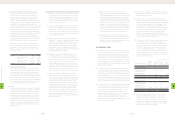
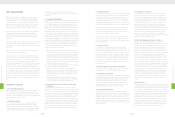
(25) EARNINGS PER SHARE
1. Earnings per share (EPS) before tax and after tax are calculated by dividing net income by the weighted average number of common shares
outstanding, which includes the deduction of the effect of treasury stock during each year. The weighted average number of shares used in
EPS calculation was 856,001 thousand shares for 2010 and 845,319 thousand shares for 2011. EPS for 2010 was calculated after the average
number of shares outstanding was adjusted retroactively for the effect of stock dividend distribution in 2011.
2.
The Accounting Research and Development Foundation issued Interpretation 2007-052, which requires companies to recognize bonuses paid
to employees, directors and supervisors as compensation expenses beginning January 1, 2008. These bonuses were previously recorded as
appropriations from earnings. If the Company may settle the bonus to employees by cash or shares, the Company should presume that the
entire amount of the bonus will be settled in shares and the resulting potential shares should be included in the weighted average number of
shares outstanding used in the calculation of diluted EPS, if the shares have a dilutive effect. The number of shares is estimated by dividing the
entire amount of the bonus by the closing price of the shares at the balance sheet date. Such dilutive effects of the potential shares needs to
be included in the calculation of diluted EPS until the stockholders resolve the number of shares to be distributed to employees at their meeting
in the following year. The related EPS information for 2010 and 2011 is as follows:
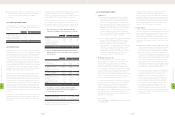
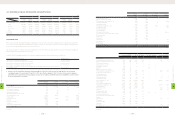
2011
Income
Tax Expense (Benefit) Income Tax Payable Income Tax Receivable Deferred
Tax Assets (Liabilities)
NT$ US$ (Note 3) NT$ US$ (Note 3) NT$ US$ (Note 3) NT$ US$ (Note 3)
HTC Norway AS. $43 $1 $44 $1 $- $- $- $-
HTC Communication Sweden AB 14 1 14 1 - - - -
HTC America Holding Inc. 126,330 4,172 - - - - (128,209) (4,234)
ABAXIA SAS 7,321 242 - - - - - -
HTC America Inc. 509,591 16,830 - - 252,748 8,347 104,038 3,436
One & Company Design, Inc. 10,418 344 - - 9,965 329 20,196 667
HTC America Innovation Inc. 60,318 1,992 14,795 489 - - 58,772 1,941
Dashwire, Inc. - - 566 19 - - - -
Beats Electronics, LLC 5,553 183 - - - - - -
Saffron Digital Inc. (9,100) (301) 26 1 - - 84 3
$9,124,639 $301,352 $10,570,682 $349,109 $263,115 $8,690 $5,921,717 $195,571
(Concluded)
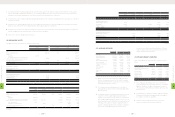
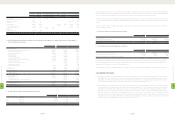
2. Deductible temporary differences and tax credit carryforwards that gave rise to deferred tax assets as of December 31,
2010 and 2011 were as follows:
2010 2011
NT$ NT$ US$ (Note 3)
Temporary differences
Allowance for loss on decline in value of inventory $596,374 $834,797 $27,570
Unrealized marketing expenses 2,705,547 4,922,310 162,565
Unrealized warranty expense 1,539,698 2,247,065 74,212
Capitalized expense 74,433 69,302 2,289
Unrealized royalties 2,522,645 4,817,745 159,112
Unrealized bad-debt expenses 64,353 153,749 5,078
Unrealized contingent losses on purchase orders 206,795 348,990 11,526
Unrealized exchange losses 387,258 138,093 4,561
Unrealized research materials expenses - 138,502 4,574
Unrealized sales allowance - 71,874 2,374
Unrealized salary and welfare 55,711 307,356 10,151
Other 11,236 129,454 4,275
Loss carryforwards 1,523 90,371 2,984
Tax credit carryforwards 3,148,156 3,125,027 103,208
Total deferred tax assets 11,313,729 17,394,635 574,479
Less: Valuation allowance (7,788,708) (11,132,656) (367,670)
Total deferred tax assets, net 3,525,021 6,261,979 206,809
Deferred tax liabilities (27,063) (30,778) (1,017)
Unrealized pension cost (76,547) (43,668) (1,442)
Unrealized valuation gains on financial instruments - (240,760) (7,951)
Unrealized investment income (3,727) (25,056) (828)
Unrealized depreciation 3,417,684 5,921,717 195,571
Less: Current portion (1,051,196) (2,246,196) (74,183)
Deferred tax assets - noncurrent $2,366,488 $3,675,521 $121,388
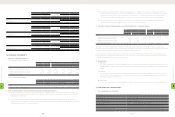
3. Details of the tax credit carryforwards were as follows:
2010 2011
Credit Grant Year Validity Period NT$ NT$ US$ (Note 3)
2007 2007-2011 $4,404 $- $-
2008 2008-2012 833,163 814,121 26,887
2009 2009-2013 2,310,589 2,310,900 76,321
2010 2010-2014 - 6 -
$3,148,156 $3,125,027 $103,208
8
FINANCIAL INFORMATION
| 208 |
8
FINANCIAL INFORMATION
| 209 |