HTC 2011 Annual Report Download - page 75
Download and view the complete annual report
Please find page 75 of the 2011 HTC annual report below. You can navigate through the pages in the report by either clicking on the pages listed below, or by using the keyword search tool below to find specific information within the annual report.-
 1
1 -
2
-
3
-
4
-
5
-
6
-
7
-
8
-
9
-
10
-
11
-
12
-
13
-
14
-
15
-
16
-
17
-
18
-
19
-
20
-
21
-
22
-
23
-
24
-
25
-
26
-
27
-
28
-
29
-
30
-
31
-
32
-
33
-
34
-
35
-
36
-
37
-
38
-
39
-
40
-
41
-
42
-
43
-
44
-
45
-
46
-
47
-
48
-
49
-
50
-
51
-
52
-
53
-
54
-
55
-
56
-
57
-
58
-
59
-
60
-
61
-
62
-
63
-
64
-
 65
65 -
 66
66 -
 67
67 -
 68
68 -
 69
69 -
 70
70 -
 71
71 -
 72
72 -
 73
73 -
 74
74 -
 75
75 -
 76
76 -
 77
77 -
 78
78 -
 79
79 -
 80
80 -
 81
81 -
 82
82 -
 83
83 -
 84
84 -
 85
85 -
86
-
87
-
88
-
89
-
90
-
91
-
92
-
93
-
94
-
95
-
96
-
97
-
98
-
99
-
100
-
101
-
102
-
103
-
104
-
105
-
106
-
107
-
108
-
109
-
110
-
111
-
112
-
113
-
114
-
115
 |
 |

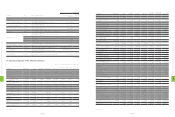
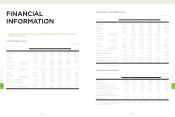
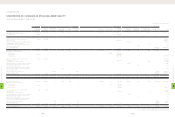
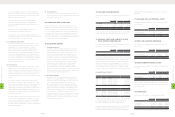
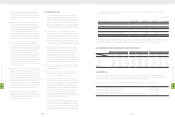
(In Thousands, Except Earnings Per Share)
2010 2011
Before
Income Tax
After
Income Tax Before Income Tax After
Income Tax
NT$ NT$ NT$ US$ (Note 3) NT$ US$ (Note 3)
BASIC EARNINGS PER SHARE (Note 23) $51.98 $46.18 $82.63 $2.73 $73.32 $2.42
DILUTED EARNINGS PER SHARE (Note 23) $51.36 $45.64 $81.05 $2.68 $71.91 $2.37
(Concluded)
The accompanying notes are an integral part of the financial statements.
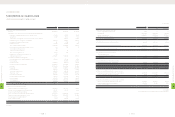
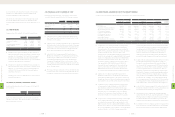
HTC CORPORATION
STATEMENTS OF INCOME
YEARS ENDED DECEMBER 31, 2010 AND 2011
2010 2011
NT$ NT$ US$ (Note 3)
REVENUES (Notes 2 and 25) $275,046,954 $455,079,186 $15,029,532
COST OF REVENUES (Notes 2, 10, 21 and 25) 195,489,982 335,325,140 11,074,512
GROSS PROFIT 79,556,972 119,754,046 3,955,020
UNREALIZED INTERCOMPANY GAINS (345,455) (1,151,531) (38,031)
REALIZED INTERCOMPANY GAINS 108,150 345,455 11,409
REALIZED GROSS PROFIT 79,319,667 118,947,970 3,928,398
OPERATING EXPENSES (Notes 21 and 25)
Selling and marketing 19,516,895 31,971,943 1,055,911
General and administrative 4,812,579 5,860,841 193,561
Research and development 12,694,850 16,254,644 536,829
Total operating expenses 37,024,324 54,087,428 1,786,301
OPERATING INCOME 42,295,343 64,860,542 2,142,097
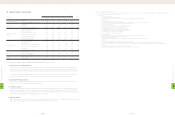
NONOPERATING INCOME AND GAINS
Interest income 286,610 622,365 20,555
Gains on equity-method investments (Notes 2 and 14) 1,457,395 2,718,362 89,777
Gains on sale of investments, net 3,001 29 1
Exchange gain (Note 2) - 1,212,432 40,042
Rental revenues (Note 25) 366 920 30
Valuation gains on financial instruments, net (Notes 2 and 6) 450,276 256,868 8,483
Other (Note 25) 338,432 249,317 8,234
Total nonoperating income and gains 2,536,080 5,060,293 167,122
NONOPERATING EXPENSES AND LOSSES
Interest expense 46 10,265 339
Loss on disposal of properties 139 - -
Exchange loss (Note 2) 303,549 - -
Impairment loss (Notes 2 and 13) 1,192 - -
Other 35,188 60,899 2,012
Total nonoperating expenses and losses 340,114 71,164 2,351
INCOME BEFORE INCOME TAX $44,491,309 $69,849,671 $2,306,868
INCOME TAX (Notes 2 and 22) (4,957,709) (7,873,875) (260,044)
NET INCOME $39,533,600 $61,975,796 $2,046,824
(In Thousands, Except Earnings Per Share)
8
FINANCIAL INFORMATION
| 146 |
8
FINANCIAL INFORMATION
| 147 |