HTC 2011 Annual Report Download - page 92
Download and view the complete annual report
Please find page 92 of the 2011 HTC annual report below. You can navigate through the pages in the report by either clicking on the pages listed below, or by using the keyword search tool below to find specific information within the annual report.-
 1
1 -
2
-
3
-
4
-
5
-
6
-
7
-
8
-
9
-
10
-
11
-
12
-
13
-
14
-
15
-
16
-
17
-
18
-
19
-
20
-
21
-
22
-
23
-
24
-
25
-
26
-
27
-
28
-
29
-
30
-
31
-
32
-
33
-
34
-
35
-
36
-
37
-
38
-
39
-
40
-
41
-
42
-
43
-
44
-
45
-
46
-
47
-
48
-
49
-
50
-
51
-
52
-
53
-
54
-
55
-
56
-
57
-
58
-
59
-
60
-
61
-
62
-
63
-
64
-
65
-
66
-
67
-
68
-
69
-
70
-
71
-
72
-
73
-
74
-
75
-
76
-
77
-
78
-
79
-
80
-
81
-
 82
82 -
 83
83 -
 84
84 -
 85
85 -
 86
86 -
 87
87 -
 88
88 -
 89
89 -
 90
90 -
 91
91 -
 92
92 -
 93
93 -
 94
94 -
 95
95 -
 96
96 -
 97
97 -
 98
98 -
 99
99 -
 100
100 -
 101
101 -
 102
102 -
103
-
104
-
105
-
106
-
107
-
108
-
109
-
110
-
111
-
112
-
113
-
114
-
115
 |
 |
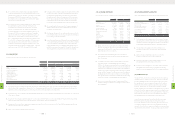
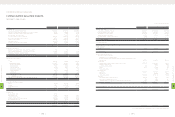
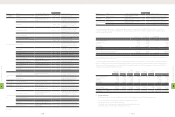
(In Thousands, Except Par Value)
2010 2011
LIABILITIES AND STOCKHOLDERS' EQUITY NT$ NT$ US$ (Note 3)
CURRENT LIABILITIES
Notes and accounts payable (Note 27) $61,974,657 $77,268,293 $2,551,878
Income tax payable (Notes 2 and 24) 6,809,417 10,570,682 349,109
Accrued expenses (Notes 17 and 27) 33,426,028 46,171,290 1,524,862
Payable for purchase of equipment 441,976 812,240 26,825
Long-term liabilities - current portion (Note 19) 12,188 - -
Other current liabilities (Notes 2 and 18) 12,976,837 17,307,355 571,596
Total current liabilities 115,641,103 152,129,860 5,024,270
LONG-TERM LIABILITIES
Long-term bank loans, net of current portion (Note 19) 12,188 - -
OTHER LIABILITIES
Guarantee deposits received 13,959 42,946 1,418
Total liabilities 115,667,250 152,172,806 5,025,688
STOCKHOLDERS' EQUITY (Note 21)
Capital stock - NT$10.00 par value
Authorized: 1,000,000 thousand shares
Issued and outstanding: 817,653 thousand shares in 2010 and 852,052 thousand shares in 2011
Common stock 8,176,532 8,520,521 281,400
Capital surplus
Additional paid-in capital - issuance of shares in excess of par 10,777,623 14,809,608 489,105
Treasury stock transactions - 1,730,458 57,150
Long-term equity investments 18,411 18,037 596
Merger 24,710 24,423 807
Expired stock options - 37,068 1,224
Retained earnings
Legal reserve 10,273,674 10,273,674 339,300
Special reserve - 580,856 19,184
Accumulated earnings 52,876,892 75,762,315 2,502,141
Other equity
Cumulative translation adjustments (Note 2) (579,849) 32,134 1,061
Net loss not recognized as pension cost (121) (293) (10)
Unrealized valuation (loss) gain on financial instruments (Notes 2 and 26) (885) 2,939 97
Treasury stock (Note 22) (6,852,493) (10,365,144) (342,321)
Equity attributable to stockholders of the parent 74,714,494 101,426,596 3,349,734
MINORITY INTEREST - 992,724 32,786
Total stockholders' equity 74,714,494 102,419,320 3,382,520
TOTAL $190,381,744 $254,592,126 $8,408,208
The accompanying notes are an integral part of the consolidated financial statements.
HTC CORPORATION AND SUBSIDIARIES
CONSOLIDATED BALANCE SHEETS
DECEMBER 31, 2010 AND 2011
2010 2011
ASSETS NT$ NT$ US$ (Note 3)
CURRENT ASSETS
Cash and cash equivalents (Notes 2 and 5) $74,462,861 $87,501,508 $2,889,841
Financial assets at fair value through profit or loss (Notes 2, 6 and 26) 450,276 256,868 8,483
Available-for-sale financial assets - current (Notes 2 and 7) 441,948 736,031 24,308
Notes receivable , net (Notes 2 and 8) - 755,450 24,950
Accounts receivable, net (Notes 2, 8 and 27) 61,614,355 63,964,341 2,112,499
Other current financial assets (Notes 9 and 27) 783,540 1,405,911 46,432
Inventories (Notes 2 and 10) 26,413,747 28,430,590 938,954
Prepayments (Note 11) 2,620,738 7,075,231 233,668
Deferred income tax assets (Notes 2 and 24) 1,051,196 2,246,196 74,183
Other current assets 767,825 1,055,480 34,859
Total current assets 168,606,486 193,427,606 6,388,177
LONG-TERM INVESTMENTS
Available-for-sale financial assets - noncurrent (Notes 2 and 7) 538 279 9
Held-to-maturity financial assets - noncurrent (Notes 2 and 12) 207,946 204,597 6,757
Financial assets carried at cost (Notes 2 and 13) 1,023,661 3,408,654 112,575
Investments accounted for by the equity method (Notes 2 and 14) - 71,732 2,369
Total long-term investments 1,232,145 3,685,262 121,710
PROPERTIES (Notes 2, 15 and 27)
Cost
Land 5,862,076 7,614,167 251,467
Buildings and structures 5,005,642 5,999,807 198,151
Machinery and equipment 7,236,349 11,298,070 373,132
Molding equipment 172,632 172,632 5,701
Computer equipment 474,299 765,177 25,271
Transportation equipment 7,378 7,710 255
Furniture and fixtures 245,041 368,025 12,154
Leased assets 5,934 6,730 222
Leasehold improvements 305,073 463,581 15,310
Total cost 19,314,424 26,695,899 881,663
Less: Accumulated depreciation (5,801,233) (7,314,359) (241,565)
Prepayments for construction-in-progress and equipment-in-transit 511,138 2,130,938 70,377
Properties, net 14,024,329 21,512,478 710,475
INTANGIBLE ASSETS (Notes 2 and 16)
Patents 208,581 11,152,098 368,311
Goodwill 497,803 10,812,564 357,098
Deferred pension cost 416 342 11
Other 228,850 595,784 19,677
Total intangible assets 935,650 22,560,788 745,097
OTHER ASSETS
Assets leased to others 50,828 - -
Refundable deposits 150,860 185,306 6,120
Deferred charges (Note 2) 243,249 763,516 25,216
Deferred income tax assets (Notes 2 and 24) 2,366,488 3,675,521 121,388
Restricted assets (Note 28) 95,688 68,700 2,269
Other (Notes 2, 11 and 20) 2,676,021 8,712,949 287,756
Total other assets 5,583,134 13,405,992 442,749
TOTAL $190,381,744 $254,592,126 $8,408,208
8
FINANCIAL INFORMATION
| 180 |
8
FINANCIAL INFORMATION
| 181 |