HTC 2011 Annual Report Download - page 71
Download and view the complete annual report
Please find page 71 of the 2011 HTC annual report below. You can navigate through the pages in the report by either clicking on the pages listed below, or by using the keyword search tool below to find specific information within the annual report.-
 1
1 -
2
-
3
-
4
-
5
-
6
-
7
-
8
-
9
-
10
-
11
-
12
-
13
-
14
-
15
-
16
-
17
-
18
-
19
-
20
-
21
-
22
-
23
-
24
-
25
-
26
-
27
-
28
-
29
-
30
-
31
-
32
-
33
-
34
-
35
-
36
-
37
-
38
-
39
-
40
-
41
-
42
-
43
-
44
-
45
-
46
-
47
-
48
-
49
-
50
-
51
-
52
-
53
-
54
-
55
-
56
-
57
-
58
-
59
-
60
-
 61
61 -
 62
62 -
 63
63 -
 64
64 -
 65
65 -
 66
66 -
 67
67 -
 68
68 -
 69
69 -
 70
70 -
 71
71 -
 72
72 -
 73
73 -
 74
74 -
 75
75 -
 76
76 -
 77
77 -
 78
78 -
 79
79 -
 80
80 -
 81
81 -
82
-
83
-
84
-
85
-
86
-
87
-
88
-
89
-
90
-
91
-
92
-
93
-
94
-
95
-
96
-
97
-
98
-
99
-
100
-
101
-
102
-
103
-
104
-
105
-
106
-
107
-
108
-
109
-
110
-
111
-
112
-
113
-
114
-
115
 |
 |

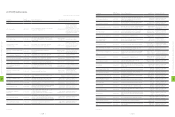
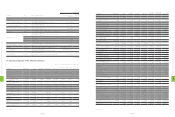
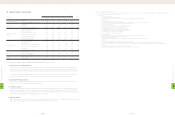
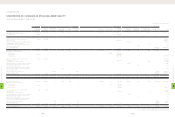
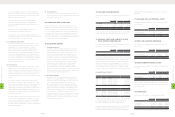
2. Financial Analysis
(1) Financial Analysis (Unconsolidated)
Item (Note 2~3)
Year As of
2012.3.31
2011 2010 2009 2008 (Note
1)
2007 (Note
1)
Capital Structure Analysis Debt Ratio (%) 59 59 45 47 38 55
Long-term Fund to Fixed Assets Ratio (%) 658 683 790 822 1,509 618
Liquidity Analysis
Current Ratio (%) 124 144 188 186 242 124
Quick Ratio (%) 101 120 171 169 218 98
Debt Services Coverage Ratio (Times) 6,806 967,203 192,463 136,167 133,409 15,307
Operating Performance
Analysis
Average Collection Turnover (Times) 6.95 5.92 4.92 6.09 6.01 4.34
Days Sales Outstanding 53 62 74 60 61 84
Average Inventory Turnover (Times) 12.11 11.77 11.71 12.68 12.14 6.79
Average Payment Turnover (Times) 4.89 4.59 3.72 4.08 4.03 2.79
Average Inventory Turnover Days 30 31 31 29 30 54
Fixed Assets Turnover (Times) 29.51 25.14 17.43 20.68 31.91 15.81
Total Assets Turnover (Times) 1.84 1.49 1.21 1.32 1.31 1.14
Profitability Analysis
Return on Total Assets (%) 29 26 22 28 37 8
Return on Equity (%) 70 56 37 49 59 18
Operating Income to Paid-in Capital Ratio (%) 761 517 306 401 533 51
Pre-tax Income to Paid-in Capital Ratio (%) 820 544 320 418 561 57
Net Margin (%) 14 14 16 19 24 7
Basic Earnings Per Share (NT$) 73.32 46.18 26.04 32.80 33.09 5.35
Cash Flow
Cash Flow Ratio (%) 59 37 51 69 116 1
Cash Flow Adequacy Ratio (%) 163 157 201 221 291 149
Cash Flow Reinvestment Ratio (%) 52 26 11 28 47 1
Leverage Operating Leverage 1.35 1.43 1.54 1.44 1.2 2.12
Financial Leverage 1 1 1 1 1 1
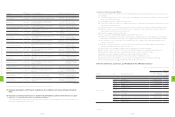
Various performance indicators remained healthy reflected the growth of HTC's business in 2011.
1. Capital Structure & Liquidity Analyses
As of year-end 2011, our debt ratio stood at 59% as last year level and current and quick ratios were both lower at 124% and 101%,
respectively. This situation reflected increases in current liabilities due to rapid business growth that saw notes and accounts payable rise
26% to NT$71.6 billion, accrued marketing expense rise 62% to NT$25.5 billion, and product warranty liabilities grow 41% to NT$12.7 billion.
HTC carries no external loans and equity funds currently cover all expenditure needs. The relatively small interest expense entered into the
income statement primarily reflects interests on tax payments, caused a lower debt services coverage ratio compared to 2010.
2. Operating Performance Analysis
Fixed asset turnover, total asset turnover, and average collection turnover were all higher due to strong revenue growth. Days sales
outstanding fell from 62 days in 2010 to 53 days in 2011. Average payment turnover increased to 4.89 due to the 72% rise in cost of revenue
for the year.
3. Profitability Analysis
Consumers are increasingly recognizing the value of HTC's innovation and the HTC brand. The market success of many flagship products
launched in 2011 helped grow revenues by 65% and net income by 57% to new historic highs. Earnings per share (EPS) rose to NT$73.32.
Operating income and pre-tax income to paid-in capital ratios rose by 761% and 820%, respectively. Return on equity (ROE) rose to 70%
from 56% in 2010.
4. Cash Flow Analysis
Reflecting strong business growth, net cash flows from operating activities grew 110% over 2010 levels to NT$85.7 billion. 2011 cash flow ratio
grew to 59%, cash flow adequacy ratio rose to 163% and cash flow reinvestment ratio rose to 52%.
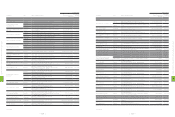
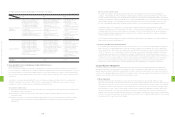
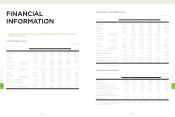
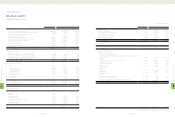
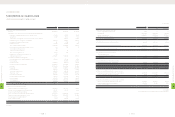
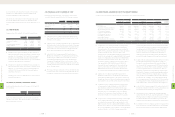
(4) Abbreviated Consolidated Income Statements
NT$ thousands (Except EPS:NT$)
Item Year 2012 1Q
2011 2010 2009 2008 2007 (Note 2)
Revenues 465,794,773 278,761,244 144,492,518 152,353,176 118,217,545 67,789,581
Gross Profit (Note 1) 131,797,527 83,868,739 46,162,981 50,990,638 44,164,632 16,970,175
Operating Income (Note 1) 68,787,767 44,132,581 24,622,907 30,345,270 30,660,255 5,104,543
Non-operating Income and Gains (Note 1) 2,783,264 1,142,944 1,420,086 2,319,489 1,771,846 703,821
Non-operating Expenses and Losses (Note 1) 147,344 311,137 646,581 929,043 200,165 252,033
Income from Continuing Operations before Income Tax 71,423,687 44,964,388 25,396,412 31,735,716 32,231,936 5,556,331
Income from Continuing Operations 62,299,048 39,514,844 22,614,413 28,552,526 28,917,712 4,804,974
Income (Loss) from Discontinued Operations - - - - - -
Income (Loss) from Extraordinary Items - - - - - -
Cumulative Effect of Changes in Accounting Principle - - - - - -
Net Income 62,299,048 39,514,844 22,614,413 28,552,526 28,917,712 4,804,974
Net Income Attribute to Shareholders of the Parent 61,975,796 39,533,600 22,608,902 28,635,349 28,938,862 4,467,192
Basic Earnings Per Share 73.32 46.18 26.04 32.80 33.09 5.35
Note 1: In accordance with 2008 and 2011 financial reporting requirements, write-downs of inventories or reversal of write-downs and product warranty costs registered in 2007 have
been reclassified as cost of revenues items.
Note 2: Excluded employee bonus expenses
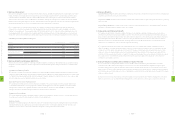
(5) The Name of the Certified Public Accountant and the Auditor's Opinion
Year CPA Firm Certified Public Accountant Auditor's Opinion
2007 Deloitte Touche Tohmatsu Ming-Hsien Yang and Kwan-Chung Lai Unqualified Opinion
2008 Deloitte Touche Tohmatsu Ming-Hsien Yang and Kwan-Chung Lai Modified Unqualified Opinion
2009 Deloitte Touche Tohmatsu Ming-Hsien Yang and Tze-Chun Wang Unqualified Opinion
2010 Deloitte Touche Tohmatsu Ming-Hsien Yang and Tze-Chun Wang Unqualified Opinion
2011 Deloitte Touche Tohmatsu Ming-Hsien Yang and Tze-Chun Wang Unqualified Opinion
8
FINANCIAL INFORMATION
| 138 |
8
FINANCIAL INFORMATION
| 139 |