HTC 2011 Annual Report Download - page 74
Download and view the complete annual report
Please find page 74 of the 2011 HTC annual report below. You can navigate through the pages in the report by either clicking on the pages listed below, or by using the keyword search tool below to find specific information within the annual report.-
 1
1 -
2
-
3
-
4
-
5
-
6
-
7
-
8
-
9
-
10
-
11
-
12
-
13
-
14
-
15
-
16
-
17
-
18
-
19
-
20
-
21
-
22
-
23
-
24
-
25
-
26
-
27
-
28
-
29
-
30
-
31
-
32
-
33
-
34
-
35
-
36
-
37
-
38
-
39
-
40
-
41
-
42
-
43
-
44
-
45
-
46
-
47
-
48
-
49
-
50
-
51
-
52
-
53
-
54
-
55
-
56
-
57
-
58
-
59
-
60
-
61
-
62
-
63
-
 64
64 -
 65
65 -
 66
66 -
 67
67 -
 68
68 -
 69
69 -
 70
70 -
 71
71 -
 72
72 -
 73
73 -
 74
74 -
 75
75 -
 76
76 -
 77
77 -
 78
78 -
 79
79 -
 80
80 -
 81
81 -
 82
82 -
 83
83 -
 84
84 -
85
-
86
-
87
-
88
-
89
-
90
-
91
-
92
-
93
-
94
-
95
-
96
-
97
-
98
-
99
-
100
-
101
-
102
-
103
-
104
-
105
-
106
-
107
-
108
-
109
-
110
-
111
-
112
-
113
-
114
-
115
 |
 |

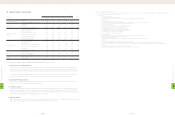
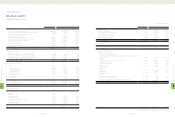
2010 2011
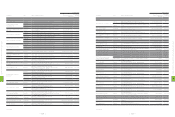
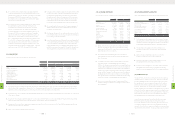
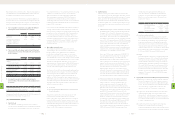
LIABILITIES AND STOCKHOLDERS' EQUITY NT$ NT$ US$ (Note 3)
CURRENT LIABILITIES
Notes and accounts payable $56,478,777 $71,650,537 $2,366,344
Accounts payable to related parties (Note 25) 1,346,981 3,639,231 120,190
Income tax payable (Notes 2 and 22) 6,416,667 9,653,090 318,805
Accrued expenses (Notes 16 and 25) 31,663,629 42,364,231 1,399,129
Payable for purchase of equipment 318,587 348,772 11,519
Other current liabilities (Notes 2, 17 and 25) 13,110,690 17,823,001 588,626
Total current liabilities 109,335,331 145,478,862 4,804,613
OTHER LIABILITIES
Guarantee deposits received 628 628 20
Total liabilities 109,335,959 145,479,490 4,804,633
STOCKHOLDERS' EQUITY (Note 19)
Capital stock - NT$10.00 par value
Authorized: 1,000,000 thousand shares
Issued and outstanding: 817,653 thousand shares in 2010 and 852,052 thousand shares in 2011
Common stock 8,176,532 8,520,521 281,400
Capital surplus
Additional paid-in capital - issuance of shares in excess of par 10,777,623 14,809,608 489,105
Treasury stock transactions - 1,730,458 57,150
Long-term equity investments 18,411 18,037 596
Merger 24,710 24,423 807
Expired stock options - 37,068 1,224
Retained earnings
Legal reserve 10,273,674 10,273,674 339,300
Special reserve - 580,856 19,184
Accumulated earnings 52,876,892 75,762,315 2,502,141
Other equity
Cumulative translation adjustments (Note 2) (579,849) 32,134 1,061
Net loss not recognized as pension cost (121) (293) (10)
Unrealized valuation (loss) gain on financial instruments (Notes 2 and 24) (885) 2,939 97
Treasury stock (Note 20) (6,852,493) (10,365,144) (342,321)
Total stockholders' equity 74,714,494 101,426,596 3,349,734
TOTAL $184,050,453 $246,906,086 $8,154,367
The accompanying notes are an integral part of the financial statements.
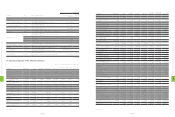
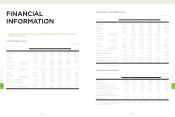
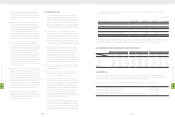
(In Thousands, Except Par Value)
HTC CORPORATION
BALANCE SHEETS
DECEMBER 31, 2010 AND 2011
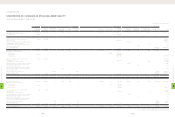
2010 2011
ASSETS NT$ NT$ US$ (Note 3)
CURRENT ASSETS
Cash and cash equivalents (Notes 2 and 5) $66,282,076 $78,872,320 $2,604,852
Financial assets at fair value through profit or loss (Notes 2, 6 and 24) 450,276 256,868 8,483
Available-for-sale financial assets - current (Notes 2 and 7) 441,948 736,031 24,308
Notes receivable, net (Notes 2 and 8) - 755,450 24,950
Accounts receivable, net (Notes 2 and 8) 35,179,038 31,284,326 1,033,202
Accounts receivable from related parties, net (Notes 2 and 25) 28,186,391 32,977,269 1,089,114
Other current financial assets (Notes 9 and 25) 717,636 1,383,927 45,706
Inventories (Notes 2 and 10) 21,920,492 25,389,320 838,513
Prepayments (Notes 11 and 25) 2,314,577 7,041,087 232,540
Deferred income tax assets (Notes 2 and 22) 925,579 1,517,302 50,111
Other current assets 457,054 558,279 18,438
Total current assets 156,875,067 180,772,179 5,970,217
LONG-TERM INVESTMENTS
Available-for-sale financial assets - noncurrent (Notes 2 and 7) 538 279 9
Held-to-maturity financial assets - noncurrent (Notes 2 and 12) 207,946 204,597 6,757
Financial assets carried at cost - noncurrent (Notes 2 and 13) 515,861 515,861 17,037
Investments accounted for by the equity method (Notes 2 and 14) 9,900,410 36,477,563 1,204,715
Prepayments for long-term investments (Notes 2 and 14) 83,665 579,485 19,138
Total long-term investments 10,708,420 37,777,785 1,247,656
PROPERTIES (Notes 2, 15 and 25)
Cost
Land 5,690,718 7,462,281 246,451
Buildings and structures 3,504,669 3,680,608 121,557
Machinery and equipment 5,564,902 7,100,072 234,488
Molding equipment 172,632 172,632 5,701
Computer equipment 343,939 398,289 13,154
Transportation equipment 6,242 6,570 217
Furniture and fixtures 147,349 204,185 6,743
Leased assets 4,712 4,712 156
Leasehold improvements 151,716 215,437 7,115
Total cost 15,586,879 19,244,786 635,582
Less: Accumulated depreciation (4,934,160) (5,850,061) (193,205)
Prepayments for construction-in-progress and equipment-in-transit 288,511 2,027,620 66,964
Properties, net 10,941,230 15,422,345 509,341
INTANGIBLE ASSETS (Note 2)
Patents 208,581 2,120,948 70,047
OTHER ASSETS
Assets leased to others 50,828 - -
Refundable deposits 79,197 78,894 2,606
Deferred charges (Note 2) 27,658 120,593 3,983
Deferred income tax assets (Notes 2 and 22) 2,419,431 3,596,520 118,779
Restricted assets (Note 26) 63,900 63,900 2,110
Other (Notes 2, 11 and 18) 2,676,141 6,952,922 229,628
Total other assets 5,317,155 10,812,829 357,106
TOTAL $184,050,453 $246,906,086 $8,154,367
8
FINANCIAL INFORMATION
| 144 |
8
FINANCIAL INFORMATION
| 145 |