HTC 2011 Annual Report Download - page 55
Download and view the complete annual report
Please find page 55 of the 2011 HTC annual report below. You can navigate through the pages in the report by either clicking on the pages listed below, or by using the keyword search tool below to find specific information within the annual report.-
 1
1 -
2
-
3
-
4
-
5
-
6
-
7
-
8
-
9
-
10
-
11
-
12
-
13
-
14
-
15
-
16
-
17
-
18
-
19
-
20
-
21
-
22
-
23
-
24
-
25
-
26
-
27
-
28
-
29
-
30
-
31
-
32
-
33
-
34
-
35
-
36
-
37
-
38
-
39
-
40
-
41
-
42
-
43
-
44
-
 45
45 -
 46
46 -
 47
47 -
 48
48 -
 49
49 -
 50
50 -
 51
51 -
 52
52 -
 53
53 -
 54
54 -
 55
55 -
 56
56 -
 57
57 -
 58
58 -
 59
59 -
 60
60 -
 61
61 -
 62
62 -
 63
63 -
 64
64 -
 65
65 -
66
-
67
-
68
-
69
-
70
-
71
-
72
-
73
-
74
-
75
-
76
-
77
-
78
-
79
-
80
-
81
-
82
-
83
-
84
-
85
-
86
-
87
-
88
-
89
-
90
-
91
-
92
-
93
-
94
-
95
-
96
-
97
-
98
-
99
-
100
-
101
-
102
-
103
-
104
-
105
-
106
-
107
-
108
-
109
-
110
-
111
-
112
-
113
-
114
-
115
 |
 |

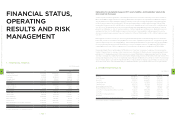
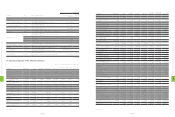
Explanations for any material changes in HTC's assets, liabilities, and shareholders' equity in the
most recent two fiscal years
Asset: Long-term investments grew 199% or around NT$2.5 billion in 2011. The increase was mainly for the new investments in
OnLive and KKBOX to largely channeled to technology R&D, market development. HTC expended the headquarter campus in
Taoyuan and built a new Taipei Headquarter building to alleviate current space shortages and prepare for anticipated growth
needs. Production capacity was increased at HTC Taoyuan and Shanghai plants to address market demand. These activities
increased 2011 fixed assets by 53%, or NT$7.5 billion, over 2010 levels. Intangible assets in 2011 rose by 2,311%, or NT$21.6 billion,
over 2010 levels. This was mainly due to the technology and brand-name advantages accrued with the purchase of numerous
patents from S3 Graphics Co., Ltd. etc. and the acquisitions of Saffron Media Group Ltd., Dashwire, Inc., Beats Electronics, LLC,
and Inquisitive Minds, Inc. The NT$7.8 billion increase in other assets in 2011 was principally royalty prepayments to earn the
discounts on royalty and per unit prices for goods. Total assets in 2011 were NT$254.6 billion, a 34%, or NT$64.2 billion increase
over 2010.
Debt: Aggressive increases of inventory to meet strong demand and anticipated continued demand growth led to an NT$15.3
billion (25%) increase in notes and accounts payable at the close of 2011 compared with year-end 2010. Strong business growth
spurred complementary rises in associated liabilities. These included an NT$3.8 billion rise in accrued income tax, NT$11.8 billion
rise in accrued marketing expense, and NT$4.0 billion rise in reserve for warranty expenses. The additional NT$36.5 billion in
current liabilities at the end of 2011 as compared to 2010 fueled this year's 32% growth in total liabilities to NT$152.2 billion.
Shareholders' Equity: Rise in capital surplus of NT$5.8 billion in 2011 was from the issuance of employees stock bonus and the
transfer of treasury shares to employees' shares issued in excess of par value. We attribute the rise in retained earnings this year
primarily to 2011's rapid business growth that increased net income by NT$22.8 billion. Higher equity adjustments for the year
were due to exchange rate volatility that increased cumulative translation adjustments by NT$610 million from year-end 2010. HTC
initiated share repurchases in 2011 to protect shareholder equity that spent NT$16.1 billion to purchase 20.1 million HTC shares and
cancel 10 million shares. In June 2011 HTC transferred 5,875,000 treasury shares to employees as performance incentive bonuses.
At the close of 2011 HTC's total shareholder equity stood at NT$102.4 billion, a rise of NT$27.7 billion or 37% over year-end 2010.
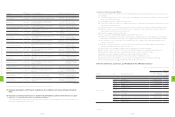
2. OPERATING RESULTS
Unit:NT$1,000
Item 2011 2010 Difference %
Revenues 465,794,773 278,761,244 187,033,529 67
Cost of Revenues 333,997,246 194,892,505 139,104,741 71
Gross Profit 131,797,527 83,868,739 47,928,788 57
Operating Expenses 63,009,760 39,736,158 23,273,602 59
Operating Income 68,787,767 44,132,581 24,655,186 56
Nonoperating Income and Gains 2,783,264 1,142,944 1,640,320 144
Nonoperating Expenses and Losses 147,344 311,137 (163,793) (53)
Income From Continuing Operations Before Income Tax 71,423,687 44,964,388 26,459,299 59
Income Tax 9,124,639 5,449,544 3,675,095 67
Income From Continuing Operations 62,299,048 39,514,844 22,784,204 58
Net Income 62,299,048 39,514,844 22,784,204 58
Net Income Attributable to Stockholders of the Parent 61,975,796 39,533,600 22,442,196 57
*All numbers above are based on consolidated financial statements.
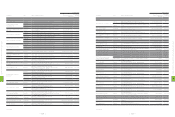
FINANCIAL STATUS,
OPERATING
RESULTS AND RISK
MANAGEMENT
1. FINANCIAL STATUS
Unit:NT$ thousands
Item 2011 2010 Difference
Amount %
Current Assets 193,427,606 168,606,486 24,821,120 15
Long-term Investments 3,685,262 1,232,145 2,453,117 199
Fixed Assets 21,512,478 14,024,329 7,488,149 53
Intangible Assets 22,560,788 935,650 21,625,138 2,311
Other Assets 13,405,992 5,583,134 7,822,858 140
Total Assets 254,592,126 190,381,744 64,210,382 34
Current Liabilities 152,129,860 115,641,103 36,488,757 32
Long-term Liabilities - 12,188 (12,188) (100)
Other Liabilities 42,946 13,959 28,987 208
Total Liabilities 152,172,806 115,667,250 36,505,556 32
Capital Stock 8,520,521 8,176,532 343,989 4
Capital Surplus 16,619,594 10,820,744 5,798,850 54
Retained Earnings 86,616,845 63,150,566 23,466,279 37
Equity Adjustments 34,780 (580,855) 615,635 (106)
Treasury Stock (10,365,144) (6,852,493) (3,512,651) 51
Equity Attributable to Stockholders of the Parent 101,426,596 74,714,494 26,712,102 36
Minority Interest 992,724 - 992,724 -
Total Stockholders' Equity 102,419,320 74,714,494 27,704,826 37
*All numbers above are based on consolidated financial statements.
6
FINANCIAL STATUS, OPERATING RESULTS AND RISK MANAGEMENT
| 106 |
6
FINANCIAL STATUS, OPERATING RESULTS AND RISK MANAGEMENT
| 107 |