HTC 2011 Annual Report Download - page 88
Download and view the complete annual report
Please find page 88 of the 2011 HTC annual report below. You can navigate through the pages in the report by either clicking on the pages listed below, or by using the keyword search tool below to find specific information within the annual report.-
 1
1 -
2
-
3
-
4
-
5
-
6
-
7
-
8
-
9
-
10
-
11
-
12
-
13
-
14
-
15
-
16
-
17
-
18
-
19
-
20
-
21
-
22
-
23
-
24
-
25
-
26
-
27
-
28
-
29
-
30
-
31
-
32
-
33
-
34
-
35
-
36
-
37
-
38
-
39
-
40
-
41
-
42
-
43
-
44
-
45
-
46
-
47
-
48
-
49
-
50
-
51
-
52
-
53
-
54
-
55
-
56
-
57
-
58
-
59
-
60
-
61
-
62
-
63
-
64
-
65
-
66
-
67
-
68
-
69
-
70
-
71
-
72
-
73
-
74
-
75
-
76
-
77
-
 78
78 -
 79
79 -
 80
80 -
 81
81 -
 82
82 -
 83
83 -
 84
84 -
 85
85 -
 86
86 -
 87
87 -
 88
88 -
 89
89 -
 90
90 -
 91
91 -
 92
92 -
 93
93 -
 94
94 -
 95
95 -
 96
96 -
 97
97 -
 98
98 -
99
-
100
-
101
-
102
-
103
-
104
-
105
-
106
-
107
-
108
-
109
-
110
-
111
-
112
-
113
-
114
-
115
 |
 |

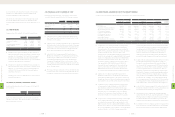
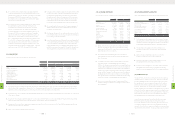
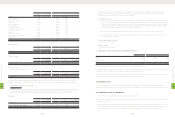
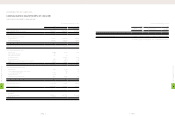
(8) Other Payables to Related Parties
December 31
2010 2011
Amount % to Total
Other Payables Amount % to Total
Other Payables
Related Party NT$ NT$ US$ (Note 3)
HTC America Inc. $173,961 28 $212,272 $7,011 30
HTC EUROPE CO, LTD. 87,266 15 101,996 3,369 14
Saffron Digital Ltd. - - 47,460 1,567 7
HTC Corporation (Shanghai WGQ) 25,802 4 32,261 1,065 5
HTC Nippon Corporation 7,084 1 21,810 720 3
High Tech Computer Asia Pacific Pte. Ltd. 47,335 8 6,145 203 1
HTC America Innovation Inc. 113,407 19 - - -
Others 21,381 4 10,383 343 1
$476,236 79 $432,327 $14,278 61
(9) Outsourcing Expenses
2010 2011
Amount % to Total
Outsourcing Expenses Amount % to Total
Outsourcing Expenses
Related Party NT$ NT$ US$ (Note 3)
HTC Electronics (Shanghai) Co., Ltd. $11,010,333 95 $24,886,361 $821,902 99
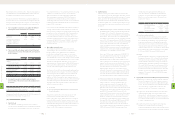
(10) Warranty Expenses
2010 2011
Amount % to Total
Warranty Expenses Amount % to Total
Warranty Expenses
Related Party NT$ NT$ US$ (Note 3)
HTC EUROPE CO., LTD. $275,025 3 $270,479 $8,933 2
HTC Corporation (Shanghai WGQ) 104,176 1 222,830 7,359 2
High Tech Computer Asia Pacific Pte. Ltd. 62,068 1 71,402 2,358 -
HTC BRASIL 13,048 - 31,791 1,050 -
HTC HK, Limited - - 13,097 433 -
High Tech Computer (H.K.) Limited 40,707 - 10,210 337 -
HTC America Inc. 793,998 8 - - -
Others 24,650 - 23,931 790 -
$1,313,672 13 $643,740 $21,260 4
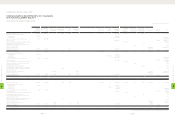
(11) Commission Expenses
2010 2011
Amount % to Total
Commission Expenses Amount % to Total
Commission Expenses
Related Party NT$ NT$ US$ (Note 3)
HTC EUROPE CO., LTD. $3,674,661 81 $5,817,831 $192,141 80
HTC Belgium BVBA/SPRL 528,017 12 498,155 16,452 7
HTC Nordic ApS 91,146 2 265,199 8,759 4
HTC Germany GmbH 48,947 1 265,462 8,767 4
HTC FRANCE CORPORATION 76,889 2 181,857 6,006 2
HTC Iberia, S.L. 16,279 - 103,229 3,409 1
HTC Netherlands B.V. 48,855 1 90,390 2,985 1
Others 37,168 1 96,369 3,183 1
$4,521,962 100 $7,318,492 $241,702 100
(12) Service and Marketing Fees
2010 2011
Amount % to Total
Service Expenses Amount % to Total
Service Expenses
Related Party NT$ NT$ US$ (Note 3)
HTC America Innovation Inc. $278,890 2 $1,845,128 $60,938 7
High Tech Computer Asia Pacific Pte. Ltd. 312,685 2 1,042,726 34,437 4
HTC(Australia and New Zealand)Pty. Ltd. 332,085 2 711,604 23,501 3
(Continued)
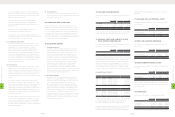
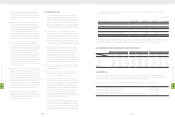
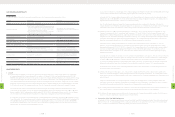
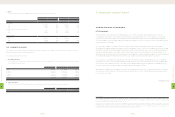
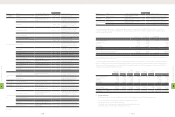
(4) Accounts Payable
December 31
2010 2011
Amount % to Total
Accounts Payable Amount % to Total
Accounts Payable
Related Party NT$ NT$ US$ (Note 3)
HTC Electronics (Shanghai) Co., Ltd. $1,184,262 2 $3,639,231 $120,190 5
Chander Electronics Corp. 126,093 - - - -
High Tech Computer Corp. (Suzhou) 36,550 - - - -
Others 76 - - - -
$1,346,981 2 $3,639,231 $120,190 5
(5) Other Receivables
December 31
2010 2011
Amount % to Total
Other Receivable Amount % to Total
Other Receivable
Related Party NT$ NT$ US$ (Note 3)
HTC America Inc. $34,034 5 $74,103 $2,448 7
HTC EUROPE CO., LTD. 1,697 - 2,129 70 -
Others 454 - 2,845 94 -
$36,185 5 $79,077 $2,612 7
(6) Prepaid Expenses
December 31
2010 2011
Amount % to Total
Prepayment Amount % to Total
Prepayment
Related Party NT$ NT$ US$ (Note 3)
HTC America Innovation Inc. $66,989 3 $378,488 $12,500 5
HTC India Private Limited 10,927 - 73,015 2,411 2
HTC HK, Limited - - 37,283 1,231 -
HTC NIPPON Corporation 42,984 2 25,386 839 -
HTC(Thailand)Ltd. - - 19,494 644 -
HTC BRASIL 35,035 2 1,917 63 -
Others 4,023 - 11,884 393 -
$159,958 7 $547,467 $18,081 7
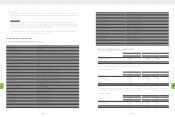
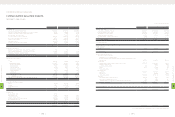
(7) Accrued Expenses
December 31
2010 2011
Amount % to Total
Accrued Expenses Amount % to Total
Accrued Expenses
Related Party NT$ NT$ US$ (Note 3)
HTC EUROPE CO., LTD. $610,022 2 $770,897 $25,460 2
High Tech Computer Asia Pacific Pte. Ltd. 100,001 - 422,582 13,956 1
HTC HK, Limited - - 402,238 13,284 1
HTC America Innovation Inc. 27,484 - 342,567 11,314 1
HTC India Private Limited 68,655 - 284,645 9,401 1
HTC Cultural and Educational Foundation 217,800 1 217,800 7,193 1
HTC (Thailand) Limited 18,903 - 134,981 4,458 -
HTC (Australia and New Zealand) Pty. Ltd. 150,526 1 126,514 4,178 -
HTC Belgium BVBA/SPRL 40,374 - 80,265 2,651 -
Communication Global Certification Inc. 31,886 - 34,151 1,128 -
Saffron Digital Ltd. - - 35,573 1,175 -
ABAXIA SAS 13,038 - 32,727 1,081 -
HTC Nordic ApS 30,803 - 26,012 859 -
HTC Innovation Limited 73,009 - 23,866 788 -
High Tech Computer (H.K.) Limited 85,871 - - - -
HTC BRASIL 37,462 - ---
Others 116,180 1 92,148 3,043 -
$1,622,014 5 $3,026,966 $99,969 7
8
FINANCIAL INFORMATION
| 172 |
8
FINANCIAL INFORMATION
| 173 |