HTC 2011 Annual Report Download - page 56
Download and view the complete annual report
Please find page 56 of the 2011 HTC annual report below. You can navigate through the pages in the report by either clicking on the pages listed below, or by using the keyword search tool below to find specific information within the annual report.-
 1
1 -
2
-
3
-
4
-
5
-
6
-
7
-
8
-
9
-
10
-
11
-
12
-
13
-
14
-
15
-
16
-
17
-
18
-
19
-
20
-
21
-
22
-
23
-
24
-
25
-
26
-
27
-
28
-
29
-
30
-
31
-
32
-
33
-
34
-
35
-
36
-
37
-
38
-
39
-
40
-
41
-
42
-
43
-
44
-
45
-
 46
46 -
 47
47 -
 48
48 -
 49
49 -
 50
50 -
 51
51 -
 52
52 -
 53
53 -
 54
54 -
 55
55 -
 56
56 -
 57
57 -
 58
58 -
 59
59 -
 60
60 -
 61
61 -
 62
62 -
 63
63 -
 64
64 -
 65
65 -
 66
66 -
67
-
68
-
69
-
70
-
71
-
72
-
73
-
74
-
75
-
76
-
77
-
78
-
79
-
80
-
81
-
82
-
83
-
84
-
85
-
86
-
87
-
88
-
89
-
90
-
91
-
92
-
93
-
94
-
95
-
96
-
97
-
98
-
99
-
100
-
101
-
102
-
103
-
104
-
105
-
106
-
107
-
108
-
109
-
110
-
111
-
112
-
113
-
114
-
115
 |
 |

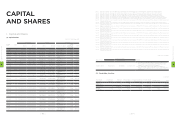
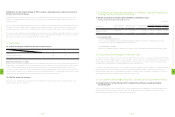
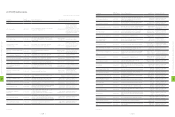
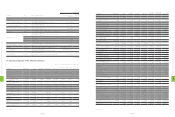
4. The Effect On Financial Operations Of Material Capital Expenditures
During The Most Recent Fiscal Year
(1) Review and analysis of material capital expenditures and funding sources
1. Material capital expenditure and funding sources
Unit:NT$1,000
Planned items Actual or projected
sources of capital
Actual or projected
date of completion
Total capital needed
(as of 12/31/2011)
Actual or projected capital utilization
2009 2010 2011
Purchase and Installation of
Equipment / Facilities working capital 2009~2011 7,726,648 490,166 3,289,848 3,946,634
Plant/Building Construction working capital 2009~2011 7,692,327 1,260,347 1,941,918 4,490,062
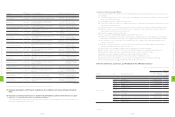
2. Anticipated Benefits
(1) New Plant/Building Construction
The new Taoyuan Headquarters campus and Taipei headquarters building are essential to expanding production and
providing HTC employees with an appropriate working environment.
(2) New Equipment / Facilities
Replacement / upgrade of equipment and facilities is critical to enhancing productivity and meeting rising market demand.
5. Investment Diversification in Recent Years
HTC’s direct Investment strategy focuses on the industry segments that enhance HTC’s core businesses and long-term strategic
developments. Evaluation analysis is based on industry dynamics, market competition, founding team experience, business model
and risk analysis. The final goal is to make key strategic investments (via minority or control) in companies and industries that
strengthen HTC’s product and service offerings and its long-term competitiveness
HTC made several strategic investments in 2011, for example, trend-setting high-performance headphones company Beats, online
media & marketing firm Saffron Media Group; Interactive online gaming platform firm Onlive; Mobile web connected services
platform Dashwire; and Children’s learning applications platform company Zoodles. In the Greater China region, we invested in
mobile banking solutions firm Shanghai F-road Commercial Services Co., Ltd.
6. Competitive Advantages, Business Growth and Assessment of Risks
(1) Potential Factors That May Influence HTC's Competitiveness/Business Growth and Related
Countermeasures
Critical competitive factors in HTC's industry include: 1) product R&D and innovation capabilities, 2) strategic partnerships with
industry leaders and 3) accurate grasp of market trends. The following assesses HTC's competitiveness in terms of factors
deemed to support and detract from HTC achieving its business goals.
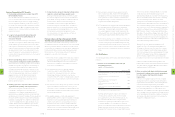
Explanations for any material changes in HTC's revenues, operating income, and pre-tax income in
the most recent two fiscal years
We attribute HTC's 67% growth in revenues in 2011 to several popular phone models launched by the company in 2011 and to
generally strong global demand for smartphones. HTC's revenues in 2011 topped NT$465.8 billion, an NT$187.0 billion (67%)
increase over 2010.
We have continuously enhanced operating efficiencies and streamlined cost structures as business expands rapidly. HTC's gross
profit grew 57% in 2011 to NT$131.8 billion. Programs to enhance brand recognition for HTC and improve user experience grew
operating expenses by NT$23.3 billion or 59%. Operating income grew this year by NT$24.7 billion (56%) to NT$68.8 billion.
HTC's revenue comes mainly from its primary business. Income from interest, forex gain/loss, and valuation gain/loss on financial
instruments accounted for nearly all non-operating gain/loss. Net non-operating income and gains in 2011 grew 217% to NT$2.6
billion. Net income before tax rose by NT$26.5 billion (59%) to NT$71.4 billion.
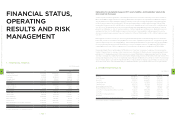
3. Cash Flows
(1) Analysis of change in cash flow for the most recent fiscal year
Year
Item 2011 2010 %
Cash Flow Ratio (%) 58 40 45
Cash Flow Adequacy Ratio (%) 158 150 5
Cash Flow Reinvestment Ratio (%) 53 32 66
Explanation and analysis of change
Business growth in 2011 increased annual revenues by 67% resulting in a 92% growth in net cash flow from operating activities to
NT$88.5 billion. Current liabilities saw a corresponding rise by 32% over the previous year, causing the cash flow ratio to increase
to 58%. Continued capacity and office expansion by HTC and its affiliates to meet anticipated future demand coupled with
increased inventories to meet current market demand increased cash flow adequacy ratio to 158%. Cash flow reinvestment ratio
rose to 53% due to a 126% rise in the numerator (net cash flows from operating activity – cash dividends) since net cash flow from
operating activities increased 92% and cash dividend payments increased 49% compared to 2010.
(2) Cash flow analysis for next year
We expect our net cash flows from operating activities and ample cash on-hand can fully support capital expenditures, cash
dividends and all other cash needs in 2012.
6
FINANCIAL STATUS, OPERATING RESULTS AND RISK MANAGEMENT
| 108 |
6
FINANCIAL STATUS, OPERATING RESULTS AND RISK MANAGEMENT
| 109 |