HTC 2011 Annual Report Download - page 51
Download and view the complete annual report
Please find page 51 of the 2011 HTC annual report below. You can navigate through the pages in the report by either clicking on the pages listed below, or by using the keyword search tool below to find specific information within the annual report.-
 1
1 -
2
-
3
-
4
-
5
-
6
-
7
-
8
-
9
-
10
-
11
-
12
-
13
-
14
-
15
-
16
-
17
-
18
-
19
-
20
-
21
-
22
-
23
-
24
-
25
-
26
-
27
-
28
-
29
-
30
-
31
-
32
-
33
-
34
-
35
-
36
-
37
-
38
-
39
-
40
-
 41
41 -
 42
42 -
 43
43 -
 44
44 -
 45
45 -
 46
46 -
 47
47 -
 48
48 -
 49
49 -
 50
50 -
 51
51 -
 52
52 -
 53
53 -
 54
54 -
 55
55 -
 56
56 -
 57
57 -
 58
58 -
 59
59 -
 60
60 -
 61
61 -
62
-
63
-
64
-
65
-
66
-
67
-
68
-
69
-
70
-
71
-
72
-
73
-
74
-
75
-
76
-
77
-
78
-
79
-
80
-
81
-
82
-
83
-
84
-
85
-
86
-
87
-
88
-
89
-
90
-
91
-
92
-
93
-
94
-
95
-
96
-
97
-
98
-
99
-
100
-
101
-
102
-
103
-
104
-
105
-
106
-
107
-
108
-
109
-
110
-
111
-
112
-
113
-
114
-
115
 |
 |

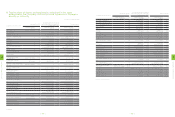
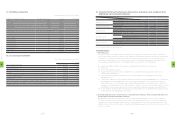
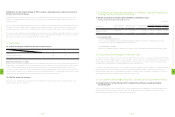
(5) Share prices for the past two fiscal years, the Company's net worth per share, earnings per share,
dividends per share, and related information:
Year
Item 2010 2011 2012.01.01~2012.03.31
Market price per share
Highest market price 921 1,300 672
Lowest market price 277.50 403 446.50
Average market price 549.61 887.12 570.12
Net worth per share (Note) Before distribution 92.48 121.03 122.24
After distribution 55.48 81.35 (Note) (Note)
Earnings per share
Weighted average shares (thousand shares) 815,239 845,319 834,256
Earnings per share 48.49 73.32 5.35
Retroactively adjusted earnings per share 46.18 73.32 (Note) (Note)
Dividends per share
Cash dividends 37 40 (Note)
Stock dividends Dividends from retained earnings 0.05 0 (Note)
Dividends from capital surplus - -
Accumulated undistributed dividend - -
Return on investment
Price/Earnings ration 11.33 12.10
Price/Dividend ratio 14.85 22.18 (Note)
Cash dividend yield 6.73% 4.51% (Note)
Note :2012 pending on the approval of the Shareholders Meeting.
(6) Dividend policy:
1. Dividend policy:
Since the Company is in the capital-intensive technology sector and growing, dividend policy is set with consideration to
factors such as current and future investment climate, demand for working capital, competitive environment, capital budget,
and interests of the shareholders, balancing dividends with long-term financial planning of the Company. Dividends are
proposed by the Board of Directors to the Shareholders' Meeting on a yearly basis. Earnings may be allocated in cash or
stock dividends, provided that the ratio of cash dividends may not be less than 50% of total dividends.
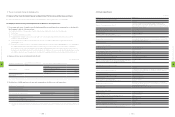
According to the Company's Articles of Incorporation, earnings shall be allocated in the following order:
(1) To pay taxes.
(2) To cover accumulated losses, if any.
(3) To appropriate 10% legal reserve unless total legal reserve accumulated has already reached the amount of the
Company's authorized capital.
(4) To pay remuneration to Directors and Supervisors up 0.3% of the balance after deducting the amounts under
subparagraphs 1 to 3.
(5) To pay bonus to employees up 5% of the balance after deducting the amounts under subparagraphs 1 to 3, or such balance
plus unappropriated retained earnings of previous years. However, the bonus may not exceed the limits on employee
bonus distributions set out in the Regulations Governing the Offering and Issuance of Securities by Issuers. Where bonus
to employees is allocated by means of new share issuance, the employees to receive bonus may include employees serving
with affiliates who meet specific requirements. Such specific requirements shall be prescribed by the Board of Directors.
(6) For any remainder, the Board of Directors shall propose dividend distribution to the Shareholders' Meeting based on the
dividend policy set forth in paragraph 2 of this Article.
2. Dividend distribution proposed at the most recent shareholders' Meeting:(Proposal adopted by the Board
pending approval by the Shareholders Meeting.)
On April 24, the Board of Directors adopted a resolution to distribute NT$33,249,085,000 in cash dividend. It translates
to NT$ 40 cash dividends per share (based on the number of outstanding shares as of book closure date, excluding share
repurchases, for the 2012 Annual Shareholders' Meeting). The Board of Directors may necessary adjustments to the actual
distribution ratio on the basis of the number of issued and outstanding shares registered in the Common Stockholders' Roster
as at the record date.
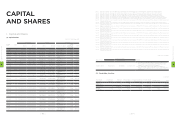
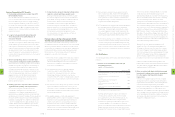
(3) Distribution of ownership:
2012.04.14 Each share having a par value of NT$10
Shareholder ownership (Unit : share) Number of shareholders Ownership Ownership
1 ~ 999 19,897 3,206,728 0.38%
1,000 ~ 5,000 39,060 67,135,764 7.88%
5,001 ~ 10,000 3,039 21,984,086 2.58%
10,001 ~ 15,000 934 11,589,986 1.36%
15,001 ~ 20,000 460 8,189,651 0.96%
20,001 ~ 30,000 425 10,579,533 1.24%
30,001 ~ 40,000 251 8,752,303 1.03%
40,001 ~ 50,000 142 6,416,995 0.75%
50,001 ~ 100,000 322 23,351,284 2.74%
100,001 ~ 200,000 236 33,552,145 3.94%
200,001 ~ 400,000 130 37,373,015 4.39%
400,001 ~ 600,000 53 26,945,922 3.16%
600,001~ 800,000 29 20,004,593 2.35%
800,001 ~ 1,000,000 17 15,051,016 1.77%
Over 1,000,001 93 557,919,149 65.47%
Total 65,088 852,052,170 100.00%
(4) List of principal shareholders:
2012.04.14 Each share having a par value of NT$10
Shares
Name of principal shareholders Current shareholding Percentage
Way-Chih Investment Co., LTD. 43,819,290 5.14%
Way-Lien Technology Inc. 37,808,231 4.44%
JPMorgan Chase Bank N.A. Taipei Branch in custody for EuroPacific Growth Fund 36,964,010 4.34%
Cher Wang 27,272,427 3.20%
JPMorgan Chase Bank N.A. Taipei Branch in custody for Capital World Growth and Income Fund 26,563,050 3.12%
Hon-Mou Investment Co., Ltd. 22,900,081 2.69%
Wen-Chi Chen 22,391,389 2.63%
JPMorgan Chase Bank N.A. Taipei Branch in custody for Capital Income Builder 18,151,973 2.13%
JPMorgan Chase Bank N.A. Taipei Branch in custody for Oppenheimer Developing Market Fund 16,035,127 1.88%
Government of Singapore 15,726,300 1.85%
5
CAPITAL AND SHARES
| 98 |
5
CAPITAL AND SHARES
| 99 |