HTC 2011 Annual Report Download - page 72
Download and view the complete annual report
Please find page 72 of the 2011 HTC annual report below. You can navigate through the pages in the report by either clicking on the pages listed below, or by using the keyword search tool below to find specific information within the annual report.-
 1
1 -
2
-
3
-
4
-
5
-
6
-
7
-
8
-
9
-
10
-
11
-
12
-
13
-
14
-
15
-
16
-
17
-
18
-
19
-
20
-
21
-
22
-
23
-
24
-
25
-
26
-
27
-
28
-
29
-
30
-
31
-
32
-
33
-
34
-
35
-
36
-
37
-
38
-
39
-
40
-
41
-
42
-
43
-
44
-
45
-
46
-
47
-
48
-
49
-
50
-
51
-
52
-
53
-
54
-
55
-
56
-
57
-
58
-
59
-
60
-
61
-
 62
62 -
 63
63 -
 64
64 -
 65
65 -
 66
66 -
 67
67 -
 68
68 -
 69
69 -
 70
70 -
 71
71 -
 72
72 -
 73
73 -
 74
74 -
 75
75 -
 76
76 -
 77
77 -
 78
78 -
 79
79 -
 80
80 -
 81
81 -
 82
82 -
83
-
84
-
85
-
86
-
87
-
88
-
89
-
90
-
91
-
92
-
93
-
94
-
95
-
96
-
97
-
98
-
99
-
100
-
101
-
102
-
103
-
104
-
105
-
106
-
107
-
108
-
109
-
110
-
111
-
112
-
113
-
114
-
115
 |
 |

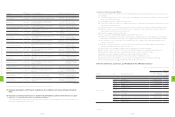
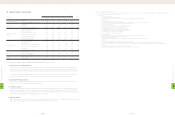
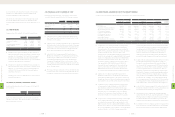
Note 1: Excluded employee bonus expenses
Note 2: In accordance with financial reporting requirements since 2008, write-downs of inventories or reversal of write-downs and product warranty costs registered during the period
2007 have been reclassified as cost of revenues items.
Note 3: Glossary
a. Capital Structure Analysis
(1) Debt Ratio=Total Liabilities / Total Assets.
(2) Long-term Fund to Fixed Assets Ratio=(Shareholders' Equity + Long-term Liabilities) / Net Fixed Assets.
b. Liquidity Analysis
(1) Current Ratio=Current Assets / Current Liabilities.
(2) Quick Ratio=(Current Assets - Inventories - Prepaid Expenses - Deferred income tax assets-current) / Current Liabilities.
(3) Times Interest Earned=Earnings before Interest and Taxes / Interest Expenses.
c. Operating Performance Analysis
(1) Average Collection Turnover= Net Sales / Average Trade Receivables.
(2) Days Sales Outstanding=365 / Average Collection Turnover.
(3) Average Inventory Turnover=Cost of Sales / Average Inventory.
(4) Average Payment Turnover=Cost of Sales / Average Trade Payables.
(5) Average Inventory Turnover Days=365 / Average Inventory Turnover.
(6) Fixed Assets Turnover=Net Sales / Net Fixed Assets.
(7) Total Assets Turnover=Net Sales / Total Assets.
d. Profitability Analysis
(1) Return on Total Assets=(Net Income + Interest Expenses * (1 - Effective Tax Rate) ) / Average Total Assets.
(2) Return on Equity=Net Income / Average Shareholders' Equity.
(3) Net Margin=Net Income / Net Sales.
(4) Earnings Per Share=(Net Income - Preferred Stock Dividend) / Weighted Average Number of Shares Outstanding.
e. Cash Flow
(1) Cash Flow Ratio=Net Cash Provided by Operating Activities / Current Liabilities.
(2) Cash Flow Adequacy Ratio=Five-year Sum of Cash from Operations / Five-year Sum of Capital Expenditures, Inventory Additions, and Cash Dividend.
(3) Cash Flow Reinvestment Ratio=(Cash Provided by Operating Activities - Cash Dividends) / (Gross Fixed Assets + Investments + Other Assets + Working Capital).
f. Leverage
(1) Operating Leverage=(Net Sales - Variable Cost) / Income from Operations.
(2) Financial Leverage=Income from Operations / (Income from Operations – Interest Expenses)
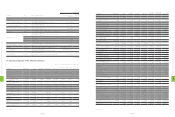
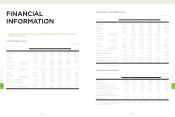
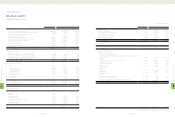
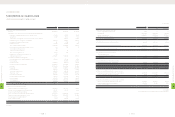
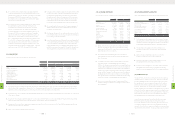
(2) Financial Analysis (Consolidated)
Item (Note 2~3)
Year As of
2012.3.31
2011 2010 2009 2008 2007 (Note
1)
Capital Structure Analysis Debt Ratio (%) 60 61 45 48 39 56
Long-term Fund to Fixed Assets Ratio (%) 476 533 664 681 1,333 457
Liquidity Analysis
Current Ratio (%) 127 146 195 190 244 130
Quick Ratio (%) 102 120 176 171 217 102
Debt Services Coverage Ratio (Times) 2,307 12,624 11,683 3,041 26,595 17,365
Operating Performance
Analysis
Average Collection Turnover (Times) 7.23 6.14 6.03 6.12 6.06 4.49
Days Sales Outstanding 50 59 61 60 60 81
Average Inventory Turnover (Times) 10.55 10.06 11.46 10.95 9.68 6.10
Average Payment Turnover (Times) 4.66 4.35 4.03 3.92 3.66 2.73
Average Inventory Turnover Days 35 36 32 33 38 60
Fixed Assets Turnover (Times) 21.65 19.88 14.6 17.09 28.01 12.07
Total Assets Turnover (Times) 1.83 1.46 1.21 1.32 1.29 1.16
Profitability Analysis
Return on Total Assets (%) 28 26 21 28 37 8
Return on Equity (%) 70 56 37 49 58 19
Operating Income to Paid-in Capital Ratio (%) 807 540 312 402 535 60
Pre-tax Income to Paid-in Capital Ratio (%) 838 550 322 420 562 65
Net Margin (%) 13 14 16 19 24 7
Basic Earnings Per Share (NT$) 73.32 46.18 26.04 32.80 33.09 5.35
Cash Flow
Cash Flow Ratio (%) 58 40 52 68 113 (1)
Cash Flow Adequacy Ratio (%) 158 150 192 211 273 143
Cash Flow Reinvestment Ratio (%) 53 32 11 28 47 (1)
Leverage Operating Leverage 1.35 1.43 1.54 1.44 1.2 2.12
Financial Leverage 1 1 1 1 1 1
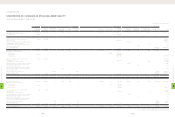
Various performance indicators remained healthy reflected the growth of HTC's business in 2011.
1. Capital Structure & Liquidity Analyses
As of year-end 2011, our debt ratio stood at 60% as the same as 2010 level, current and quick ratios were both lower at 127% and 102%,
respectively. This situation reflected increases in current liabilities due to rapid business growth that saw notes and accounts payable rise
25% to NT$77.2 billion, accrued marketing expense rise 68% to NT$29.1 billion, and product warranty liabilities grow 44% to NT$13.1 billion.
HTC carries no external loans and equity funds currently cover all expenditure needs. The relatively small interest expense entered into the
income statement primarily reflects interests on tax payments, caused a lower debt services coverage ratio compared to 2010.
2. Operating Performance Analysis
Fixed asset turnover and total asset turnover were all higher due to strong revenue growth. Days sales outstanding fell to 50 days in 2011.
Average inventory turnover days kept at 35 days at 2011 year-end.
3. Profitability Analysis
Consumers are increasingly recognizing the value of HTC's innovation and the HTC brand. The market success of many flagship products
launched in 2011 helped grow revenues by 67% and net income by 58% to new historic highs. Earnings per share (EPS) rose to NT$73.32.
Operating income and pre-tax income to paid-in capital ratios rose by 807% and 838%, respectively. Return on total asset (ROA) and Return
on equity (ROE) rose to 28% and 70% from 26% and 56% in 2010, respectively.
4. Cash Flow Analysis
Reflecting strong business growth, net cash flows from operating activities grew 92% over 2010 levels to NT$88.5 billion. 2011 cash flow ratio
grew to 58%, cash flow adequacy ratio rose to 158% and cash flow reinvestment ratio rose to 53%.
8
FINANCIAL INFORMATION
| 140 |
8
FINANCIAL INFORMATION
| 141 |