HTC 2011 Annual Report Download - page 100
Download and view the complete annual report
Please find page 100 of the 2011 HTC annual report below. You can navigate through the pages in the report by either clicking on the pages listed below, or by using the keyword search tool below to find specific information within the annual report.-
 1
1 -
2
-
3
-
4
-
5
-
6
-
7
-
8
-
9
-
10
-
11
-
12
-
13
-
14
-
15
-
16
-
17
-
18
-
19
-
20
-
21
-
22
-
23
-
24
-
25
-
26
-
27
-
28
-
29
-
30
-
31
-
32
-
33
-
34
-
35
-
36
-
37
-
38
-
39
-
40
-
41
-
42
-
43
-
44
-
45
-
46
-
47
-
48
-
49
-
50
-
51
-
52
-
53
-
54
-
55
-
56
-
57
-
58
-
59
-
60
-
61
-
62
-
63
-
64
-
65
-
66
-
67
-
68
-
69
-
70
-
71
-
72
-
73
-
74
-
75
-
76
-
77
-
78
-
79
-
80
-
81
-
82
-
83
-
84
-
85
-
86
-
87
-
88
-
89
-
 90
90 -
 91
91 -
 92
92 -
 93
93 -
 94
94 -
 95
95 -
 96
96 -
 97
97 -
 98
98 -
 99
99 -
 100
100 -
 101
101 -
 102
102 -
 103
103 -
 104
104 -
 105
105 -
 106
106 -
 107
107 -
 108
108 -
 109
109 -
 110
110 -
111
-
112
-
113
-
114
-
115
 |
 |

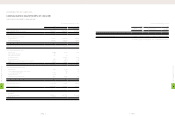
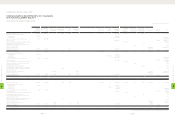
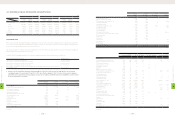
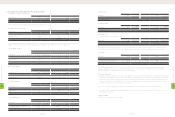
Forward Exchange Contracts
2010
Buy/Sell Currency Settlement Period/Date Contract Amount
Buy USD/CAD 2011.01.26 USD 250
Buy USD/JPY 2011.01.12∼2011.02.23 USD 18,187
Sell EUR/USD 2011.01.05∼2011.03.18 EUR 531,000
Sell GBP/USD 2011.01.12∼2011.03.25 GBP 57,400
Sell USD/NTD 2011.01.03∼2011.01.31 USD 447,000
2011
Buy/Sell Currency Settlement Period/Date Contract Amount
Buy USD/CAD 2012.01.11∼2012.02.22 USD 28,010
Buy USD/RMB 2012.01.04∼2012.01.31 USD 105,000
Sell EUR/USD 2012.01.04∼2012.03.30 EUR 339,000
Sell GBP/USD 2012.01.11∼2012.02.22 GBP 17,100
Net gain on derivative financial instruments in 2010 was NT$759,889
thousand, including a realized settlement gain of NT$309,613
thousand and a valuation gain of NT$450,276 thousand.
Net gain on derivative financial instruments in 2011 was NT$172,501
thousand (US$5,697 thousand), including a realized settlement loss
of NT$84,367 thousand (US$2,786 thousand) and a valuation gain
of NT$256,868 thousand (US$8,483 thousand). Note 26 has more
information.
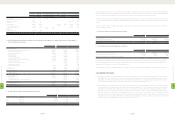
(7) AVAILABLE-FOR-SALE FINANCIAL ASSETS
Available-for-sale financial assets as of December 31, 2010 and 2011
were as follows:
2010 2011
NT$ NT$ US$ (Note 3)
Mutual funds $441,948 $736,031 $24,308
Domestic quoted stocks 538 279 9
Less: Current portion (441,948) (736,031) (24,308)
$538 $279 $9
(8) NOTES AND ACCOUNTS RECEIVABLE
Notes and accounts receivable as of December 31, 2010 and 2011
were as follows:
2010 2011
NT$ NT$ US$ (Note 3)
Notes receivable $- $755,450 $24,950
Accounts receivable 62,620,703 65,518,876 2,163,839
Accounts receivable from
related parties 2,143 473 16
Less: Allowance for doubtful
accounts (1,008,491) (1,555,008) (51,356)
$61,614,355 $64,719,791 $2,137,449
(9) OTHER CURRENT FINANCIAL ASSETS
Other current financial assets as of December 31, 2010 and 2011 were
as follows:
2010 2011
NT$ NT$ US$ (Note 3)
Other receivables $747,983 $1,129,204 $37,293
Agency payments 22,139 249,644 8,245
Interest receivables 11,376 23,261 768
Others 2,042 3,802 126
$783,540 $1,405,911 $46,432
Other receivables were primarily prepayments on behalf of vendors
or customers, withholding income tax on employees' bonuses, and
other compensation.
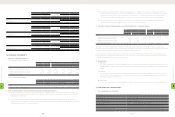
(10) INVENTORIES
Inventories as of December 31, 2010 and 2011 were as follows:
2010 2011
NT$ NT$ US$ (Note 3)
Finished goods $1,859,010 $2,189,984 $72.327
Work-in-process 6,707,423 8,868,137 292,881
Raw materials 13,075,800 17,251,140 569,739
Inventory in transit 4,771,514 121,329 4,007
$26,413,747 $28,430,590 $938,954
As of December 31, 2010 and 2011, the allowances for inventory
devaluation were NT$3,535,521 thousand and NT$4,930,857 thousand
(US$162,847 thousand), respectively.
The write-down of inventories to their net realizable value, which
amounted to NT$2,686,168 thousand in 2010 and NT$3,381,137 thousand
and (US$111,666 thousand) in 2011, was recognized as cost of sales.
(11) PREPAYMENTS
Prepayments as of December 31, 2010 and 2011 were as follows:
2010 2011
NT$ NT$ US$ (Note 3)
Royalty $1,837,341 $4,828,102 $159,454
Prepayments to suppliers 38,990 1,248,922 41,247
Net input VAT 361,152 320,544 10,586
Software and hardware
maintenance 115,425 311,416 10,285
Molding equipment 91,058 188,242 6,217
Marketing 66,295 43,200 1,427
Rent 40,812 15,488 511
Others 69,665 119,317 3,941
$2,620,738 $7,075,231 $233,668
1. Prepayments for royalty were primarily for discount purposes
and were classified as current or noncurrent on the basis of their
maturities. As of December 31, 2010 and 2011, the noncurrent
prepayments of NT$2,484,156 thousand and NT$6,489,046
thousand and (US$214,309 thousand), respectively, were
classified as other assets (Note 30 has more information).
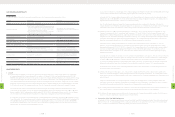
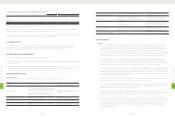
24. Treasury Stock
The Company adopted the Statement of Financial Accounting
Standards No. 30 - "Accounting for Treasury Stocks," which requires
the treasury stock held by the Company to be accounted for by the
cost method. The cost of treasury stock is shown as a deduction to
arrive at stockholders' equity, while gain or loss from selling treasury
stock is treated as an adjustment to capital surplus.
When treasury stocks are sold and the selling price is above
the book value, the difference should be credited to the capital
surplus - treasury stock transactions. If the selling price is below
the book value, the difference should first be offset against
capital surplus from the same class of treasury stock transactions,
and any remainder should be debited to retained earnings. The
carrying value of treasury stocks should be calculated using the
weighted-average method.
When the Company's treasury stock is retired, the treasury stock
account should be credited, and the capital surplus - premium
on stock account and capital stock account should be debited
proportionately according to the share ratio. The difference
should be credited to capital surplus or debited to capital surplus
and/or retained earnings.
25. Reclassifications
Certain 2010 accounts have been reclassified to be consistent
with the presentation of the consolidated financial statements as
of and for the year ended December 31, 2011.
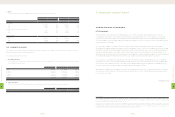
(3) TRANSLATION INTO U.S. DOLLARS
The consolidated financial statements are stated in New Taiwan
dollars. The translation of the 2011 New Taiwan dollar amounts
into U.S. dollar amounts are included solely for the convenience of
readers, using the noon buying rate of NT$30.279 to US$1.00 quoted
by Reuters on December 31, 2011. The convenience translation
should not be construed as representations that the New Taiwan
dollar amounts have been, could have been, or could in the future be,
converted into U.S. dollars at this or any other exchange rate.
(4) ACCOUNTING CHANGES
1. Financial Instruments
On January 1, 2011, the Company adopted the newly revised
Statement of Financial Accounting Standards (SFAS) No. 34 -
"Financial Instruments: Recognition and Measurement." The main
revisions include (1) finance lease receivables are now covered
by SFAS No. 34; (2) the scope of the applicability of SFAS No.
34 to insurance contracts is amended; (3) loans and receivables
originated by the Company are now covered by SFAS No. 34; (4)
additional guidelines on impairment testing of financial assets
carried at amortized cost when a debtor has financial difficulties
and the terms of obligations have been modified; and (5)
accounting treatment by a debtor for modifications in the terms
of obligations. This accounting change had no material effect on
the Company's consolidated financial statements as of and for the
year ended December 31, 2011.
2. Operating Segments
On January 1, 2011, the Company adopted the newly issued
SFAS No. 41 - "Operating Segments." The requirements of the
statement are based on the information about the components
of the Company that management uses to make decisions
about operating matters. SFAS No. 41 requires identification
of operating segments on the basis of internal reports that are
regularly reviewed by the Company's chief operating decision
maker in order to allocate resources to the segments and assess
their performance. This statement supersedes SFAS No. 20 -
"Segment Reporting." For this accounting change, the Company
restated the segment information as of and for the year ended
December 31, 2010 to conform to the disclosures as of and for
the year ended December 31, 2011.
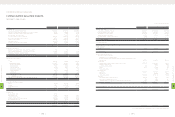
(5) CASH AND CASH EQUIVALENTS
Cash and cash equivalents as of December 31, 2010 and 2011 were as
follows:
2010 2011
NT$ NT$ US$ (Note 3)
Cash on hand $4,304 $6,436 $212
Cash in banks 22,343,340 28,207,009 931,570
Time deposits 52,115,217 59,288,063 1,958,059
$74,462,861 $87,501,508 $2,889,841
On time deposits, interest rates ranged from 0.14% to 1.50% and from
0.15% to 1.345% as of December 31, 2010 and 2011, respectively.
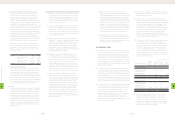
(6) FINANCIAL ASSETS AND LIABILITIES AT FAIR
VALUE THROUGH PROFIT OR LOSS
Financial assets and liabilities at fair value through profit or loss as of
December 31, 2010 and 2011 were as follows:
2010 2011
NT$ NT$ US$ (Note 3)
Derivatives - financial assets
Exchange contracts $450,276 $256,868 $8,483
The Company had derivative transactions in 2010 and 2011 to manage
exposures related to exchange rate fluctuations. However, these
transactions did not meet the criteria for hedge accounting under
Statement of Financial Accounting Standards No. 34 - "Financial
Instruments: Recognition and Measurement." Thus, the Company
had no hedge accounting in 2010 and 2011. Outstanding forward
exchange contracts as of December 31, 2010 and 2011 were as follows:
8
FINANCIAL INFORMATION
| 196 |
8
FINANCIAL INFORMATION
| 197 |