HTC 2011 Annual Report Download - page 107
Download and view the complete annual report
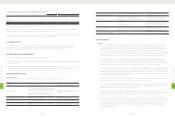
Please find page 107 of the 2011 HTC annual report below. You can navigate through the pages in the report by either clicking on the pages listed below, or by using the keyword search tool below to find specific information within the annual report.-
 1
1 -
2
-
3
-
4
-
5
-
6
-
7
-
8
-
9
-
10
-
11
-
12
-
13
-
14
-
15
-
16
-
17
-
18
-
19
-
20
-
21
-
22
-
23
-
24
-
25
-
26
-
27
-
28
-
29
-
30
-
31
-
32
-
33
-
34
-
35
-
36
-
37
-
38
-
39
-
40
-
41
-
42
-
43
-
44
-
45
-
46
-
47
-
48
-
49
-
50
-
51
-
52
-
53
-
54
-
55
-
56
-
57
-
58
-
59
-
60
-
61
-
62
-
63
-
64
-
65
-
66
-
67
-
68
-
69
-
70
-
71
-
72
-
73
-
74
-
75
-
76
-
77
-
78
-
79
-
80
-
81
-
82
-
83
-
84
-
85
-
86
-
87
-
88
-
89
-
90
-
91
-
92
-
93
-
94
-
95
-
96
-
 97
97 -
 98
98 -
 99
99 -
 100
100 -
 101
101 -
 102
102 -
 103
103 -
 104
104 -
 105
105 -
 106
106 -
 107
107 -
 108
108 -
 109
109 -
 110
110 -
 111
111 -
 112
112 -
 113
113 -
 114
114 -
 115
115
 |
 |

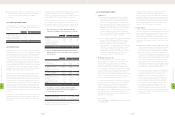
(3) The fair values of financial instruments at fair value through profit or loss, available-for-sale and held-to-maturity financial assets are
based on quoted market prices in an active market, and their fair values can be reliably measured. If the securities do not have market
prices, fair value is measured on the basis of financial or other information. The Company uses estimates and assumptions that are
consistent with information that market participants would use in setting a price for these securities with no quoted market prices.
(4) Financial assets carried at cost are investments in unquoted shares, which have no quoted prices in an active market and entail an
unreasonably high cost to obtain verifiable fair values. Therefore, no fair value is presented.
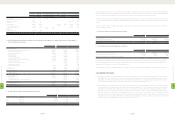
3. Fair Values of Financial Instruments Based on Quoted Market Prices or Valuation Methods
Fair Values Based on Quoted Market Prices Fair Values Based on Valuation Methods
December 31 December 31
2010 2011 2010 2011
NT$ NT$ US$ (Note 3) NT$ NT$ US$ (Note 3)
Assets
Financial assets at fair value through profit or loss - current $- $- $- $450,276 $256,868 $8,483
Available-for-sale financial assets - current 441,948 736,031 24,308 - - -
Available-for-sale financial assets - noncurrent 538 279 9 - - -
Held-to-maturity financial assets - noncurrent 207,467 203,783 6,730 - - -
Financial assets carried at cost - - - 1,023,661 3,408,654 112,575
There was no loss or gain recognized for 2010 and 2011 on the fair value changes of derivatives with fair values estimated using valuation
techniques. However, the Company recognized unrealized gains of NT$773 thousand for 2010 and NT$3,824 thousand (US$126 thousand) for 2011
under stockholders' equity for the changes in fair value of available-for-sale financial assets.
As of December 31, 2010 and 2011, financial assets exposed to fair value interest rate risk amounted to NT$207,946 thousand and NT$204,597
thousand (US$6,757 thousand), respectively; financial assets exposed to cash flow interest rate risk amounted to NT$52,210,905 thousand and
NT$59,356,763 thousand (US$1,960,328 thousand), respectively.
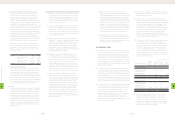
4. Financial Risks
(1) Market risk
The Company uses derivative contracts for hedging purposes, i.e., to reduce any adverse effect of exchange rate fluctuations of accounts
receivable/payable. The gains or losses on these contracts almost offset the gains or losses on the hedged items. Thus, market risk is not
material.
(2) Credit risk
The Company deals only with banks with good credit standing based on the banks' reputation and takes into account past experience
with them. Moreover, the Company has a series of control procedures for derivative transactions. Management believes its exposure to
counter-parties' default on contracts is low.
(3) Cash flow risk
The Company's operating funds are deemed sufficient to meet the cash flow demand; thus, liquidity risk is not considered significant.
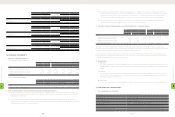
(27) RELATED-PARTY TRANSACTIONS
1. The related parties were as follows:
Related Party Relationship with the Company
Xander International Corp. Chairperson is an immediate relative of HTC's chairperson
VIA Technologies, Inc. Same chairperson as HTC's
Chander Electronics Corp. Same chairperson as HTC's
Way-Lien Technology Co., Ltd. Significant stockholder of HTC
WTI Investment International, Ltd. Its significant stockholder in substance is HTC's chairperson
VIABASE CO., LTD. Chairperson of its parent company is the same as HTC's
S3 Graphics Co., Ltd. A wholly owned subsidiary of VIABASE CO., LTD. and WTI Investment International, Ltd.
Employees' Welfare Committee Employees' Welfare Committee of HTC
HTC Cultural and Educational Foundation A nonprofit organization with over one third of its total funds donated by the Company
HTC Social Welfare and Charity Foundation A nonprofit organization with over one third of its total funds donated by the Company
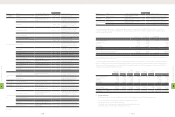
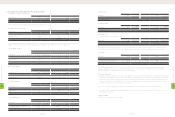
2010
Amount (Numerator) Shares
(Denominator)
(In Thousands)
EPS (In Dollars)
Before Income Tax After Income Tax Before Income Tax After Income Tax
NT$ NT$ NT$ NT$
Basic EPS $44,491,309 $39,533,600 856,001 $51.98 $46.18
Bonus to employees - - 10,201
Diluted EPS $44,491,309 $39,533,600 866,202 $51.36 $45.64
2011
Amount (Numerator) Shares
(Denominator)
(In Thousands)
EPS (In Dollars)
Before Income Tax After Income Tax Before Income Tax After Income Tax
NT$ NT$ NT$ NT$
Basic EPS $69,849,671 $61,975,796 845,319 $82.63 $73.32
Bonus to employees - - 16,527
Diluted EPS $69,849,671 $61,975,796 861,846 $81.05 $71.91
2011
Amount (Numerator) Shares
(Denominator)
(In Thousands)
EPS (In Dollars)
Before Income Tax After Income Tax Before Income Tax After Income Tax
US$ (Note 3) US$ (Note 3) US$ (Note 3) US$ (Note 3)
Basic EPS $2,306,868 $2,046,824 845,319 $2.73 $2.42
Bonus to employees - - 16,527
Diluted EPS $2,306,868 $2,046,824 861,846 $2.68 $2.37
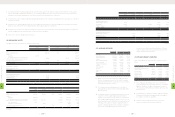
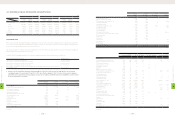
(26) FINANCIAL INSTRUMENTS
1. Fair Value of Financial Instruments
(1) Nonderivative financial instruments
December 31
2010 2011
Carrying Amount Fair Value Carrying Amount Fair Value
NT$ NT$ NT$ US$ (Note 3) NT$ US$ (Note 3)
Assets
Available-for-sale financial assets - current $441,948 $441,948 $736,031 $24,308 $736,031 $24,308
Available-for-sale financial assets - noncurrent 538 538 279 9 279 9
Held-to-maturity financial assets - noncurrent 207,946 207,467 204,597 6,757 203,783 6,730
Financial assets carried at cost 1,023,661 1,023,661 3,408,654 112,575 3,408,654 112,575
(2) Derivative financial instruments
December 31
2010 2011
Carrying Amount Fair Value Carrying Amount Fair Value
NT$ NT$ NT$ US$ (Note 3) NT$ US$ (Note 3)
Assets
Financial assets at fair value through profit or loss - current $450,276 $450,276 $256,868 $8,483 $256,868 $8,483
2. Methods and Assumptions Used in Determining Fair Values of Financial Instruments
(1) Not subject to Statement of Financial Accounting Standards No. 34 - "Financial Instruments: Recognition and Measurement" are cash,
receivables, other current financial assets, payables, accrued expenses and other current financial liabilities, which have carrying amounts
that approximate their fair values.
(2) The financial instruments listed above exclude refundable deposits, guarantee deposits and long-term bank loans. The fair values of
long-term bank loans were based on the present value of future cash flows discounted at the average interest rates for time deposits with
maturities similar to those of the financial instruments.
8
FINANCIAL INFORMATION
| 210 |
8
FINANCIAL INFORMATION
| 211 |