Google 2012 Annual Report Download - page 80
Download and view the complete annual report
Please find page 80 of the 2012 Google annual report below. You can navigate through the pages in the report by either clicking on the pages listed below, or by using the keyword search tool below to find specific information within the annual report.-
 1
1 -
2
-
3
-
4
-
5
-
6
-
7
-
8
-
9
-
10
-
11
-
12
-
13
-
14
-
15
-
16
-
17
-
18
-
19
-
20
-
21
-
22
-
23
-
24
-
25
-
26
-
27
-
28
-
29
-
30
-
31
-
32
-
33
-
34
-
35
-
36
-
37
-
38
-
39
-
40
-
41
-
42
-
43
-
44
-
45
-
46
-
47
-
48
-
49
-
50
-
51
-
52
-
53
-
54
-
55
-
56
-
57
-
58
-
59
-
60
-
61
-
62
-
63
-
64
-
65
-
66
-
67
-
68
-
69
-
 70
70 -
 71
71 -
 72
72 -
 73
73 -
 74
74 -
 75
75 -
 76
76 -
 77
77 -
 78
78 -
 79
79 -
 80
80 -
 81
81 -
 82
82 -
 83
83 -
 84
84 -
 85
85 -
 86
86 -
 87
87 -
 88
88 -
 89
89 -
 90
90 -
91
-
92
 |
 |

74 GOOGLE INC. |Form10-K
PART II
ITEM8.Notes to Consolidated Financial Statements
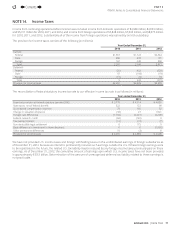
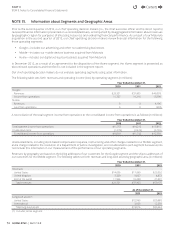
NOTE15. Information about Segments and Geographic Areas
Prior to the second quarter of 2012, our chief operating decision makers (i.e., the chief executive o cer and his direct reports)
reviewed fi nancial information presented on a consolidated basis, accompanied by disaggregated information about revenues
by geographic region for purposes of allocating resources and evaluating fi nancial performance. As a result of our Motorola
acquisition in the second quarter of 2012, our chief operating decision makers review fi nancial information for the following
three operating segments:
•Google—includes our advertising and other non-advertising businesses
•Mobile—includes our mobile devices business acquired from Motorola
•Home—includes our digital set-top box business acquired from Motorola
In December2012, as a result of an agreement for the disposition of the Home segment, the Home segment is presented as
discontinued operations and therefore is not included in the segment report.
Our chief operating decision makers do not evaluate operating segments using asset information.
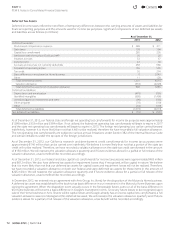
The following table sets forth revenues and operating income (loss) by operating segment (in millions):
Year Ended December31,
2010 2011 2012
Google:
Revenues $29,321 $37,905 $ 46,039
Income from operations 11,757 14,216 16,308
Mobile:
Revenues 0 0 4,136
Loss from operations 0 0 (393)
A reconciliation of the total segment income from operations to the consolidated income from operations is as follows (in millions):
Year Ended December31,
2010 2011 2012
Total segment income from operations $11,757 $14,216 $15,915
Unallocated items (1,376) (2,474) (3,155)
Consolidated income from operations $10,381 $11,742 $12,760
Unallocated items, including stock-based compensation expense, restructuring and other charges related to our Mobile segment,
and a charge related to the resolution of a Department of Justice investigation, are not allocated to each segment because we do
not include this information in our measurement of the performance of our operating segments.
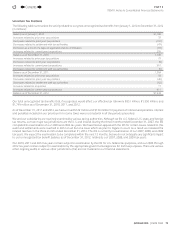
Revenues by geography are based on the billing addresses of our customers for the Google segment and the ship-to-addresses of
our customers for the Mobile segment. The following tables set forth revenues and long-lived assets by geographic area (in millions):
Year Ended December31,
2010 2011 2012
Revenues:
United States $14,056 $17,560 $23,502
United Kingdom 3,329 4,057 4,872
Rest of the world 11,936 16,288 21,801
Total revenues $29,321 $37,905 $50,175
As of December31,
2011 2012
Long-lived assets(1) :
United States $15,963 $20,985
International 3,853 12,359
Total long-lived assets $19,816 $33,344
(1) Includes Home segment.
Contents
44