Google 2012 Annual Report Download - page 35
Download and view the complete annual report
Please find page 35 of the 2012 Google annual report below. You can navigate through the pages in the report by either clicking on the pages listed below, or by using the keyword search tool below to find specific information within the annual report.-
 1
1 -
2
-
3
-
4
-
5
-
6
-
7
-
8
-
9
-
10
-
11
-
12
-
13
-
14
-
15
-
16
-
17
-
18
-
19
-
20
-
21
-
22
-
23
-
24
-
 25
25 -
 26
26 -
 27
27 -
 28
28 -
 29
29 -
 30
30 -
 31
31 -
 32
32 -
 33
33 -
 34
34 -
 35
35 -
 36
36 -
 37
37 -
 38
38 -
 39
39 -
 40
40 -
 41
41 -
 42
42 -
 43
43 -
 44
44 -
 45
45 -
46
-
47
-
48
-
49
-
50
-
51
-
52
-
53
-
54
-
55
-
56
-
57
-
58
-
59
-
60
-
61
-
62
-
63
-
64
-
65
-
66
-
67
-
68
-
69
-
70
-
71
-
72
-
73
-
74
-
75
-
76
-
77
-
78
-
79
-
80
-
81
-
82
-
83
-
84
-
85
-
86
-
87
-
88
-
89
-
90
-
91
-
92
 |
 |

29GOOGLE INC. |Form10-K
PART II
ITEM7.Management’s Discussion and Analysis of Financial Condition and Results ofOperations
Aggregate paid clicks on Google websites and Google Network Members’ websites increased approximately 34% from 2011 to 2012
and approximately 25% from 2010 to 2011. Average cost-per-click on Google websites and Google Network Members’ websites
decreased approximately 12% from 2011 to 2012 and increased approximately 3% from 2010 to 2011. The rate of change in
aggregate paid clicks and average cost-per-click, and their correlation with the rate of change in revenues, has fl uctuated and
may fl uctuate in the future because of various factors, including the revenue growth rates on our websites compared to those of
our Google Network Members, advertiser competition for keywords, changes in foreign currency exchange rates, seasonality, the
fees advertisers are willing to pay based on how they manage their advertising costs, changes in advertising quality or formats,
and general economic conditions. In addition, tra c growth in emerging markets compared to more mature markets and across
various advertising verticals and channels, including mobile devices, also contributes to these fl uctuations. Changes in aggregate
paid clicks and average cost-per-click may not be indicative of our performance or advertiser experiences in any specifi c geographic
market, vertical, or industry.
We believe that the increase in the number of paid clicks on Google websites and Google Network Members’ websites is substantially
the result of our commitment to improving the relevance and quality of both our search results and the advertisements displayed,
which we believe results in a better user experience, which in turn results in more searches, advertisers, and Google Network
Members and other partners.
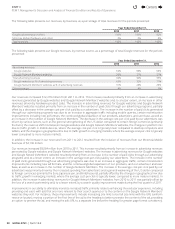
Revenues by Geography
The following table presents our Google domestic and international revenues as a percentage of Google revenues, determined
based on the billing addresses of our customers for our Google business:
Year Ended December31,
2010 2011 2012
United States 48% 46% 46%
United Kingdom 11% 11% 11%
Rest of the world 41% 43% 43%
The following table presents our consolidated domestic and international revenues as a percentage of consolidated revenues,
determined based on the billing addresses of our customers for our Google business, and shipping addresses of our customers
for our Motorola Mobile business:
Year Ended December31,
2010 2011 2012
United States 48% 46% 47%
United Kingdom 11% 11% 10%
Rest of the world 41% 43% 43%
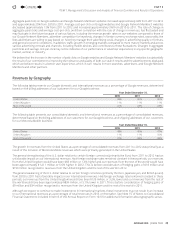
The growth in revenues from the United States as a percentage of consolidated revenues from 2011 to 2012 was primarily as a
result of the inclusion of Motorola Mobile revenues which were primarily generated in the UnitedStates.
The general strengthening of the U.S. dollar relative to certain foreign currencies (primarily the Euro) from 2011 to 2012 had an
unfavorable impact on our international revenues. Had foreign exchange rates remained constant in these periods, our revenues
from the United Kingdom would have been $68million or 1.4% higher and our revenues from the rest of the world would have
been approximately $1,211million or 5.6% higher in 2012. This is before consideration of hedging gains of $18million and
$199million recognized to revenues from the United Kingdom and the rest of the world in 2012.
The general weakening of the U.S. dollar relative to certain foreign currencies (primarily the Euro, Japanese yen, and British pound)
from 2010 to 2011 had a favorable impact on our international revenues. Had foreign exchange rates remained constant in these
periods, our revenues from the United Kingdom would have been $129million, or 3.2%, lower and our revenues from the rest of
the world would have been approximately $834million, or 5.1%, lower in 2011. This is before consideration of hedging gains of
$9million and $34million recognized to revenues from the United Kingdom and the rest of the world in 2011.
Although we expect to continue to make investments in international markets, these investments may not result in an increase
in our international revenues as a percentage of total revenues in 2013 or thereafter. See Note15 of Notes to Consolidated
Financial Statements included in Item8 of this Annual Report on Form 10-K for additional information about geographic areas.
4
Contents
4