Google 2012 Annual Report Download - page 32
Download and view the complete annual report
Please find page 32 of the 2012 Google annual report below. You can navigate through the pages in the report by either clicking on the pages listed below, or by using the keyword search tool below to find specific information within the annual report.-
 1
1 -
2
-
3
-
4
-
5
-
6
-
7
-
8
-
9
-
10
-
11
-
12
-
13
-
14
-
15
-
16
-
17
-
18
-
19
-
20
-
21
-
 22
22 -
 23
23 -
 24
24 -
 25
25 -
 26
26 -
 27
27 -
 28
28 -
 29
29 -
 30
30 -
 31
31 -
 32
32 -
 33
33 -
 34
34 -
 35
35 -
 36
36 -
 37
37 -
 38
38 -
 39
39 -
 40
40 -
 41
41 -
 42
42 -
43
-
44
-
45
-
46
-
47
-
48
-
49
-
50
-
51
-
52
-
53
-
54
-
55
-
56
-
57
-
58
-
59
-
60
-
61
-
62
-
63
-
64
-
65
-
66
-
67
-
68
-
69
-
70
-
71
-
72
-
73
-
74
-
75
-
76
-
77
-
78
-
79
-
80
-
81
-
82
-
83
-
84
-
85
-
86
-
87
-
88
-
89
-
90
-
91
-
92
 |
 |

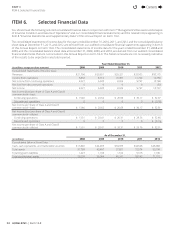
26 GOOGLE INC. |Form10-K
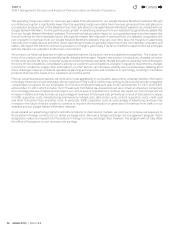
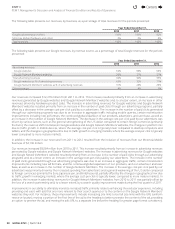
PART II
ITEM7.Management’s Discussion and Analysis of Financial Condition and Results ofOperations
The operating margin we realize on revenues generated from ads placed on our Google Network Members’ websites through
our AdSense program is signifi cantly lower than the operating margin we realize from revenues generated from ads placed on
our websites because most of the advertiser fees from ads served on Google Network Members’ websites are shared with our
Google Network Members. For the past fi ve years, growth in advertising revenues from our websites has generally exceeded that
from our Google Network Members’ websites. This trend has had a positive impact on our operating margins, and we expect that
this will continue for the foreseeable future, although the relative rate of growth in revenues from our websites compared to the
rate of growth in revenues from our Google Network Members’ websites may vary over time. Also, the margins on advertising
revenues from mobile devices and other newer advertising formats are generally lower than those from desktop computers and
tablets. We expect this trend to continue to pressure our margins, particularly if we fail to realize the opportunities we anticipate
with the transition to a dynamic multi-screen environment.
We conduct our Motorola business in highly competitive markets, facing both new and established competitors. The markets for
many of our products are characterized by rapidly changing technologies, frequent new product introductions, changing consumer
trends, short product life cycles, consumer loyalty and evolving industry standards. Market disruptions caused by new technologies,
the entry of new competitors, consolidations among our customers and competitors, changes in regulatory requirements, changes
in economic conditions, supply chain interruptions or other factors, can introduce volatility into our businesses. Meeting all of
these challenges requires consistent operational planning and execution and investment in technology, resulting in innovative
products that meet the needs of our customers around the world.
From an overall business perspective, we continue to invest aggressively in our systems, data centers, corporate facilities, information
technology infrastructure, and employees. We increased our hiring in 2012, and we may continue to do so and to provide competitive
compensation programs for our employees. Our full-time employee headcount was 32,467 at December31, 2011 and 53,861
atDecember31, 2012, which includes 16,317 headcount from Motorola. Acquisitions will also remain an important component
of our strategy and use of capital, and we expect our current pace of acquisitions to continue.We expect our cost of revenues will
increase in dollars and may increase as a percentage of revenues in future periods, primarily as a result of forecasted increases
in tra c acquisition costs, manufacturing and inventory-related costs, data center costs, content acquisition costs, credit card
and other transaction fees, and other costs. In particular, tra c acquisition costs as a percentage of advertising revenues may
increase in the future if we are unable to continue to improve the monetization or generation of revenues from tra c on our
websites and our Google Network Members’ websites.
As we expand our advertising programs and other products to international markets, we continue to increase our exposure to
fl uctuations in foreign currency to U.S. dollar exchange rates. Wehave a foreign exchange risk management program that is
designed to reduce our exposure to fl uctuations in foreign currency exchange rates. However, this program will not fully off set
the eff ect of fl uctuations on our revenues and earnings.
Contents
44