Google 2012 Annual Report Download - page 33
Download and view the complete annual report
Please find page 33 of the 2012 Google annual report below. You can navigate through the pages in the report by either clicking on the pages listed below, or by using the keyword search tool below to find specific information within the annual report.-
 1
1 -
2
-
3
-
4
-
5
-
6
-
7
-
8
-
9
-
10
-
11
-
12
-
13
-
14
-
15
-
16
-
17
-
18
-
19
-
20
-
21
-
22
-
 23
23 -
 24
24 -
 25
25 -
 26
26 -
 27
27 -
 28
28 -
 29
29 -
 30
30 -
 31
31 -
 32
32 -
 33
33 -
 34
34 -
 35
35 -
 36
36 -
 37
37 -
 38
38 -
 39
39 -
 40
40 -
 41
41 -
 42
42 -
 43
43 -
44
-
45
-
46
-
47
-
48
-
49
-
50
-
51
-
52
-
53
-
54
-
55
-
56
-
57
-
58
-
59
-
60
-
61
-
62
-
63
-
64
-
65
-
66
-
67
-
68
-
69
-
70
-
71
-
72
-
73
-
74
-
75
-
76
-
77
-
78
-
79
-
80
-
81
-
82
-
83
-
84
-
85
-
86
-
87
-
88
-
89
-
90
-
91
-
92
 |
 |

27GOOGLE INC. |Form10-K
PART II
ITEM7.Management’s Discussion and Analysis of Financial Condition and Results ofOperations
Results of Operations
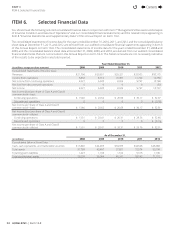
We completed our acquisition of Motorola on May22, 2012 (the acquisition date). The operating results of Motorola were included
in our Consolidated Statements of Income from the acquisition date through December31, 2012. In December2012, we entered
into an agreement for the disposition of the Motorola Home segment and the related fi nancial results are presented as net loss
from discontinued operations in the Consolidated Statements of Income.
Subsequent to the acquisition in May2012, we initiated a restructuring plan in our Motorola business. See Note9 of Notes to
Consolidated Financial Statements included in Item8 of this Annual Report on Form 10-K for further discussion of this restructuring
plan and the associated restructuring charges. We continue to evaluate our plans and further restructuring actions may occur,
which may cause us to incur additional restructuring charges, some of which may be signifi cant.
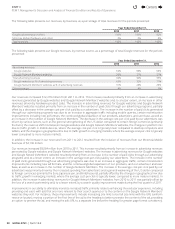
The following table presents our historical operating results as a percentage of revenues for the periods indicated:
Year Ended December31,
2010 2011 2012
Consolidated Statements of Income Data:
Revenues:
Google (advertising and other) 100.0% 100.0% 91.8%
Motorola Mobile (hardware and other) 0 0 8.2
Total revenues 100.0% 100.0% 100.0%
Costs and expenses:
Cost of revenues—Google (advertising and other) 35.5 34.8 34.2
Cost of revenues—Motorola Mobile (hardware and other) 0 0 6.9
Research and development 12.8 13.6 13.5
Sales and marketing 9.5 12.1 12.2
General and administrative 6.8 7.2 7.8
Charge related to the resolution of Department of Justice investigation 0 1.3 0
Total costs and expenses 64.6 69.0 74.6
Income from operations 35.4 31.0 25.4
Interest and other income, net 1.4 1.5 1.3
Income from continuing operations before income taxes 36.8 32.5 26.7
Provision for income taxes 7.8 6.8 5.2
Net income from continuing operations 29.0 25.7 21.5
Net loss from discontinued operations 0 0 (0.1)
Net income 29.0% 25.7% 21.4%
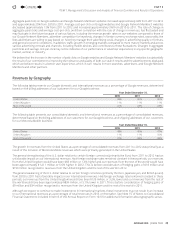
Revenues
The following table presents our revenues, by revenue source, for the periods presented (in millions):
Year Ended December31,
2010 2011 2012
Google:
Advertising revenues:
Google websites $19,444 $26,145 $31,221
Google Network Members’ websites 8,792 10,386 12,465
Total advertising revenues 28,236 36,531 43,686
Other revenues 1,085 1,374 2,353
Total Google revenues (advertising and other) $29,321 $37,905 $46,039
Motorola Mobile:
Total Motorola Mobile revenues (hardware and other) 0 0 4,136
Total revenues $29,321 $37,905 $50,175
4
Contents
4