Google 2012 Annual Report Download - page 52
Download and view the complete annual report
Please find page 52 of the 2012 Google annual report below. You can navigate through the pages in the report by either clicking on the pages listed below, or by using the keyword search tool below to find specific information within the annual report.-
 1
1 -
2
-
3
-
4
-
5
-
6
-
7
-
8
-
9
-
10
-
11
-
12
-
13
-
14
-
15
-
16
-
17
-
18
-
19
-
20
-
21
-
22
-
23
-
24
-
25
-
26
-
27
-
28
-
29
-
30
-
31
-
32
-
33
-
34
-
35
-
36
-
37
-
38
-
39
-
40
-
41
-
 42
42 -
 43
43 -
 44
44 -
 45
45 -
 46
46 -
 47
47 -
 48
48 -
 49
49 -
 50
50 -
 51
51 -
 52
52 -
 53
53 -
 54
54 -
 55
55 -
 56
56 -
 57
57 -
 58
58 -
 59
59 -
 60
60 -
 61
61 -
 62
62 -
63
-
64
-
65
-
66
-
67
-
68
-
69
-
70
-
71
-
72
-
73
-
74
-
75
-
76
-
77
-
78
-
79
-
80
-
81
-
82
-
83
-
84
-
85
-
86
-
87
-
88
-
89
-
90
-
91
-
92
 |
 |
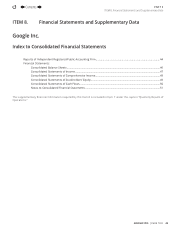
46 GOOGLE INC. |Form10-K
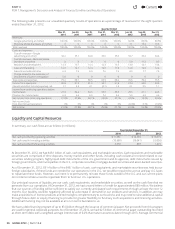
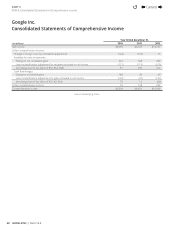
PART II
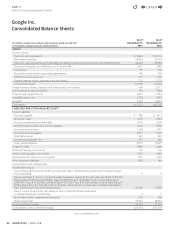
ITEM8.Consolidated Balance Sheets
Google Inc.
Consolidated Balance Sheets
(In millions, except share and par value amounts which are refl ected
in thousands, and par value per share amounts)
As of
December31,
2011
As of
December31,
2012
ASSETS
Current assets:
Cash and cash equivalents $ 9,983 $14,778
Marketable securities 34,643 33,310
Total cash, cash equivalents, and marketable securities (including securities loaned of $2,778 and $3,160) 44,626 48,088
Accounts receivable, net of allowance of $133 and $581 5,427 7,885
Inventories 35 505
Receivable under reverse repurchase agreements 745 700
Deferred income taxes, net 215 1,144
Prepaid revenue share, expenses and other assets 1,710 2,132
Total current assets 52,758 60,454
Prepaid revenue share, expenses and other assets, non-current 499 2,011
Non-marketable equity securities 790 1,469
Property and equipment, net 9,603 11,854
Intangible assets, net 1,578 7,473
Goodwill 7,346 10,537
Total assets $72,574 $93,798
LIABILITIES AND STOCKHOLDERS’ EQUITY
Current liabilities:
Accounts payable $ 588 $ 2,012
Short-term debt 1,218 2,549
Accrued compensation and benefi ts 1,818 2,239
Accrued expenses and other current liabilities 1,370 3,258
Accrued revenue share 1,168 1,471
Securities lending payable 2,007 1,673
Deferred revenue 547 895
Income taxes payable, net 197 240
Total current liabilities 8,913 14,337
Long-term debt 2,986 2,988
Deferred revenue, non-current 44 100
Income taxes payable, non-current 1,693 2,046
Deferred income taxes, net, non-current 287 1,872
Other long-term liabilities 506 740
Commitments and contingencies
Stockholders’ equity:
Convertible preferred stock, $0.001 par value per share, 100,000 shares authorized; no shares issued
and outstanding 0 0
ClassA and Class B common stock and additional paid-in capital, $0.001 par value per share: 9,000,000
shares authorized (Class A 6,000,000, Class B 3,000,000) and 12,000,000 shares authorized (Class A
9,000,000, Class B 3,000,000); 324,895 (ClassA 257,553, Class B 67,342) andparvalue of $325 (Class A
$258, Class B $67) and 329,979 (ClassA 267,448, Class B 62,531) andparvalue of $330 (Class A $267,
Class B $63) shares issued and outstanding 20,264 22,835
Class C capital stock, $0.001 par value per share, 3,000,000 shares authorized;
no shares issued and outstanding 0 0
Accumulated other comprehensive income 276 538
Retained earnings 37,605 48,342
Total stockholders’ equity 58,145 71,715
Total liabilities and stockholders’ equity $72,574 $93,798
See accompanying notes.
Contents
44