Google 2012 Annual Report Download - page 64
Download and view the complete annual report
Please find page 64 of the 2012 Google annual report below. You can navigate through the pages in the report by either clicking on the pages listed below, or by using the keyword search tool below to find specific information within the annual report.-
 1
1 -
2
-
3
-
4
-
5
-
6
-
7
-
8
-
9
-
10
-
11
-
12
-
13
-
14
-
15
-
16
-
17
-
18
-
19
-
20
-
21
-
22
-
23
-
24
-
25
-
26
-
27
-
28
-
29
-
30
-
31
-
32
-
33
-
34
-
35
-
36
-
37
-
38
-
39
-
40
-
41
-
42
-
43
-
44
-
45
-
46
-
47
-
48
-
49
-
50
-
51
-
52
-
53
-
 54
54 -
 55
55 -
 56
56 -
 57
57 -
 58
58 -
 59
59 -
 60
60 -
 61
61 -
 62
62 -
 63
63 -
 64
64 -
 65
65 -
 66
66 -
 67
67 -
 68
68 -
 69
69 -
 70
70 -
 71
71 -
 72
72 -
 73
73 -
 74
74 -
75
-
76
-
77
-
78
-
79
-
80
-
81
-
82
-
83
-
84
-
85
-
86
-
87
-
88
-
89
-
90
-
91
-
92
 |
 |

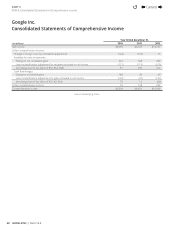
58 GOOGLE INC. |Form10-K
PART II
ITEM8.Notes to Consolidated Financial Statements
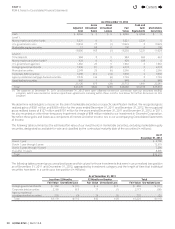
As of December31, 2012
Adjusted
Cost
Gross
Unrealized
Gains
Gross
Unrealized
Losses
Fair
Value
Cash and
Cash
Equivalents
Marketable
Securities
Cash $ 8,066 $ 0 $ 0 $ 8,066 $ 8,066 $ 0
Level 1:
Money market and other funds 5,221 0 0 5,221 5,221 0
U.S. government notes 10,853 77 (1) 10,929 0 10,929
Marketable equity securities 12 88 0 100 0 100
16,086 165 (1) 16,250 5,221 11,029
Level 2:
Time deposits 984 0 0 984 562 422
Money market and other funds(1) 929 0 0 929 929 0
U.S. government agencies 1,882 20 0 1,902 0 1,902
Foreign government bonds 1,996 81 (3) 2,074 0 2,074
Municipal securities 2,249 23 (6) 2,266 0 2,266
Corporate debt securities 7,200 414 (14) 7,600 0 7,600
Agency residential mortgage-backed securities 7,039 136 (6) 7,169 0 7,169
Asset-backed securities 847 1 0 848 0 848
23,126 675 (29) 23,772 1,491 22,281
Total $47,278 $840 $(30 ) $48,088 $14,778 $33,310
(1) The balances at December31, 2011 and December31, 2012 were cash collateral received in connection with our securities lending
program, which was invested in reverse repurchase agreements maturing within three months. See below for further discussion on this
program.
We determine realized gains or losses on the sale of marketable securities on a specifi c identifi cation method. We recognized gross
realized gains of $381million and $383million for the years ended December31, 2011 and December31, 2012. We recognized
gross realized losses of $127million and $101million for the years ended December31, 2011 and December31, 2012. In 2011,
we also recorded an other-than-temporary impairment charge of $88million related to our investment in Clearwire Corporation.
We refl ect these gains and losses as a component of interest and other income, net, in our accompanying Consolidated Statements
of Income.
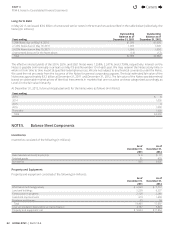
The following table summarizes the estimated fair value of our investments in marketable securities, excluding marketable equity
securities, designated as available-for-sale and classifi ed by the contractual maturity date of the securities (in millions):
As of
December31, 2012
Due in 1 year $ 4,708
Due in 1 year through 5 years 12,310
Due in 5 years through 10 years 7,296
Due after 10 years 8,896
Total $33,210
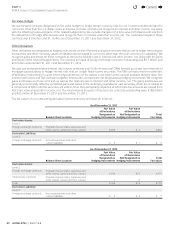
The following tables present gross unrealized losses and fair values for those investments that were in an unrealized loss position
as of December31, 2011 and December31, 2012, aggregated by investment category and the length of time that individual
securities have been in a continuous loss position (in millions):
As of December31, 2011
Less than 12 Months 12 Months or Greater Total
Fair Value Unrealized Loss Fair Value Unrealized Loss Fair Value Unrealized Loss
Foreign government bonds $ 302 $ (11) $ 6 $ 0 $ 308 $ (11)
Corporate debt securities 2,160 (97) 17 (1) 2,177 (98)
Agency residential
mortgage-backed securities 716 (3) 19 (2) 735 (5)
Total $3,178 $(111) $42 $ (3) $ 3,220 $(114 )
Contents
44