Google 2012 Annual Report Download - page 28
Download and view the complete annual report
Please find page 28 of the 2012 Google annual report below. You can navigate through the pages in the report by either clicking on the pages listed below, or by using the keyword search tool below to find specific information within the annual report.-
 1
1 -
2
-
3
-
4
-
5
-
6
-
7
-
8
-
9
-
10
-
11
-
12
-
13
-
14
-
15
-
16
-
17
-
 18
18 -
 19
19 -
 20
20 -
 21
21 -
 22
22 -
 23
23 -
 24
24 -
 25
25 -
 26
26 -
 27
27 -
 28
28 -
 29
29 -
 30
30 -
 31
31 -
 32
32 -
 33
33 -
 34
34 -
 35
35 -
 36
36 -
 37
37 -
 38
38 -
39
-
40
-
41
-
42
-
43
-
44
-
45
-
46
-
47
-
48
-
49
-
50
-
51
-
52
-
53
-
54
-
55
-
56
-
57
-
58
-
59
-
60
-
61
-
62
-
63
-
64
-
65
-
66
-
67
-
68
-
69
-
70
-
71
-
72
-
73
-
74
-
75
-
76
-
77
-
78
-
79
-
80
-
81
-
82
-
83
-
84
-
85
-
86
-
87
-
88
-
89
-
90
-
91
-
92
 |
 |

22 GOOGLE INC. |Form10-K
PART II
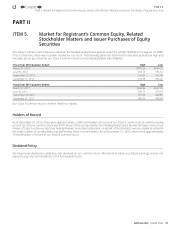
ITEM5.Market for Registrant’s Common Equity, Related Stockholder Matters and Issuer Purchases of Equity Securities
Stock Performance Graph
This performance graph shall not be deemed “fi led” for purposes of Section18 of the Securities Exchange Act of 1934, as amended
(theExchange Act), or incorporated by reference into any fi ling of Google under the Securities Act of 1933, as amended, or the Exchange
Act, except as shall be expressly set forth by specifi c reference in such fi ling.
The following graph compares the 5-year cumulative total return to shareholders on Google Inc.’s common stock relative to
the cumulative total returns of the S&P 500 index, the RDG Internet Composite index, and the NASDAQ Composite index. An
investment of $100 (with reinvestment of all dividends) is assumed to have been made in the company’s common stock and in
each index on December31, 2007 and its relative performance is tracked through December31, 2012. The returns shown are
based on historical results and are not intended to suggest future performance.
COMPARISON OF 5 YEAR CUMULATIVE TOTAL RETURN*
Among Google Inc., the S&P 500 Index, the NASDAQ Composite Index,
and the RDG Internet Composite Index
12/07 3/08 6/08 9/08 12/08 3/09 6/09 9/09 12/09 3/10 6/10 9/10 12/10 3/11 6/11 9/11 12/11 3/12 6/12 9/12 12/12
* $100 invested on December 31, 2007 in stock or index, including reinvestment of dividends. Fiscal year ending December 31.
Copyright© 2013 S&P, a division of The McGraw-Hill Companies Inc. All rights reserved.
$0
$20
$40
$60
$80
$100
$120
$140
$160
Google Inc. S&P 500 NASDAQ Composite RDG Internet Composite
Contents
44