Google 2012 Annual Report Download - page 34
Download and view the complete annual report
Please find page 34 of the 2012 Google annual report below. You can navigate through the pages in the report by either clicking on the pages listed below, or by using the keyword search tool below to find specific information within the annual report.-
 1
1 -
2
-
3
-
4
-
5
-
6
-
7
-
8
-
9
-
10
-
11
-
12
-
13
-
14
-
15
-
16
-
17
-
18
-
19
-
20
-
21
-
22
-
23
-
 24
24 -
 25
25 -
 26
26 -
 27
27 -
 28
28 -
 29
29 -
 30
30 -
 31
31 -
 32
32 -
 33
33 -
 34
34 -
 35
35 -
 36
36 -
 37
37 -
 38
38 -
 39
39 -
 40
40 -
 41
41 -
 42
42 -
 43
43 -
 44
44 -
45
-
46
-
47
-
48
-
49
-
50
-
51
-
52
-
53
-
54
-
55
-
56
-
57
-
58
-
59
-
60
-
61
-
62
-
63
-
64
-
65
-
66
-
67
-
68
-
69
-
70
-
71
-
72
-
73
-
74
-
75
-
76
-
77
-
78
-
79
-
80
-
81
-
82
-
83
-
84
-
85
-
86
-
87
-
88
-
89
-
90
-
91
-
92
 |
 |

28 GOOGLE INC. |Form10-K
PART II
ITEM7.Management’s Discussion and Analysis of Financial Condition and Results ofOperations
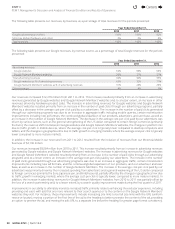
The following table presents our revenues, by business, as a percentage of total revenues for the periods presented:
Year Ended December31,
2010 2011 2012
Google (advertising and other) 100% 100% 92%
Motorola Mobile (hardware and other) 0% 0% 8%
Total revenues 100% 100% 100%
The following table presents our Google revenues, by revenue source, as a percentage of total Google revenues for the periods
presented:
Year Ended December31,
2010 2011 2012
Advertising revenues:
Google websites 66% 69% 68%
Google Network Members’ websites 30% 27% 27%
Total advertising revenues 96% 96% 95%
Google websites as % of advertising revenues 69% 72% 71%
Google Network Members’ websites as % of advertising revenues 31% 28% 29%
Other revenues 4% 4% 5%
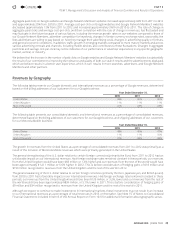
Our revenues increased $12,270million from 2011 to 2012. This increase resulted primarily from an increase in advertising
revenues generated by Google websites and Google Network Members’ websites and, to a lesser extent, an increase in other
revenues driven by hardware product sales. The increase in advertising revenues for Google websites and Google Network
Members’ websites resulted primarily from an increase in the number of paid clicks through our advertising programs, partially
off set by a decrease in the average cost-per-click paid by our advertisers. The increase in the number of paid clicks generated
through our advertising programs was due to an increase in aggregate tra c including mobile queries, certain monetization
improvements including new ad formats, the continued global expansion of our products, advertisers, and user base, as well as
an increase in the number of Google Network Members. The decrease in the average cost-per-click paid by our advertisers was
driven by various factors, such as the general strengthening of the U.S dollar compared to certain foreign currencies (primarily
the Euro), the revenue shift mix between Google websites and Google Network Members’ websites, the changes in platform mix
due to tra c growth in mobile devices, where the average cost-per-click is typically lower compared to desktop computers and
tablets, and the changes in geographical mix due to tra c growth in emerging markets, where the average cost-per-click is typically
lower compared to more mature markets.
In addition, the increase in our revenues from 2011 to 2012 resulted from the inclusion of revenues from our Motorola Mobile
business of $4,136million.
Our revenues increased $8,584million from 2010 to 2011. This increase resulted primarily from an increase in advertising revenues
generated by Google websites and Google Network Members’ websites. The increase in advertising revenues for Google websites
and Google Network Members’ websites resulted primarily from an increase in the number of paid clicks through our advertising
programs and, to a lesser extent, an increase in the average cost-per-click paid by our advertisers. The increase in the number
of paid clicks generated through our advertising programs was due to an increase in aggregate tra c, certain monetization
improvements including new ad formats, and the continued global expansion of our products, and our advertiser and user
base, as well as an increase in the number of Google Network Members. The increase in the average cost-per-click paid by our
advertisers was primarily driven by the increased spending from advertisers and a general weakening of the U.S dollar compared
to foreign currencies (primarily the Euro, Japanese yen, and British pound), partially off set by the changes in geographical mix due
to tra c growth in emerging markets, where the average cost-per-click is typically lower, compared to more mature markets. In
addition, the increase in advertising revenues for Google Network Members’ websites from 2010 to 2011 was partially off set by
the loss of a search partnership and, to a lesser extent, by a search quality improvement made during the fi rst quarter of 2011.
Improvements in our ability to ultimately monetize increased tra c primarily relate to enhancing the end user experience, including
providing end users with ads that are more relevant to their search queries or to the content on the Google Network Members’
websites they visit. For instance, these improvements includeincreasing site links to be full size links with the URL (uniform
resource locator), moving a portion of the fi rst line of the ad to the heading to better promote the content of the ad, providing
an option to preview the ad, and moving the ad’sURL to a separate line below the heading for greater page format consistency.
Contents
44