Google 2012 Annual Report Download - page 62
Download and view the complete annual report
Please find page 62 of the 2012 Google annual report below. You can navigate through the pages in the report by either clicking on the pages listed below, or by using the keyword search tool below to find specific information within the annual report.-
 1
1 -
2
-
3
-
4
-
5
-
6
-
7
-
8
-
9
-
10
-
11
-
12
-
13
-
14
-
15
-
16
-
17
-
18
-
19
-
20
-
21
-
22
-
23
-
24
-
25
-
26
-
27
-
28
-
29
-
30
-
31
-
32
-
33
-
34
-
35
-
36
-
37
-
38
-
39
-
40
-
41
-
42
-
43
-
44
-
45
-
46
-
47
-
48
-
49
-
50
-
51
-
 52
52 -
 53
53 -
 54
54 -
 55
55 -
 56
56 -
 57
57 -
 58
58 -
 59
59 -
 60
60 -
 61
61 -
 62
62 -
 63
63 -
 64
64 -
 65
65 -
 66
66 -
 67
67 -
 68
68 -
 69
69 -
 70
70 -
 71
71 -
 72
72 -
73
-
74
-
75
-
76
-
77
-
78
-
79
-
80
-
81
-
82
-
83
-
84
-
85
-
86
-
87
-
88
-
89
-
90
-
91
-
92
 |
 |

56 GOOGLE INC. |Form10-K
PART II
ITEM8.Notes to Consolidated Financial Statements
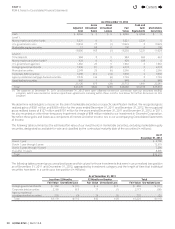
The following table sets forth the computation of basic and diluted net income per share of ClassA and Class B common stock
(in millions, except share amounts which are refl ected in thousands and per share amounts):
Year Ended December31,
2010 2011 2012
Class A Class B Class A Class B Class A Class B
Basic net income (loss) per share:
Numerator
Allocation of undistributed
earnings—continuing operations $ 6,569 $ 1,936 $ 7,658 $ 2,079 $ 8,641 $ 2,147
Allocation of undistributed
earnings—discontinued operations 0 0 0 0 (41) (10)
Total $ 6,569 $ 1,936 $ 7,658 $ 2,079 $ 8,600 $ 2,137
Denominator
Weighted-average
commonsharesoutstanding 246,168 72,534 253,862 68,916 262,078 65,135
Number of shares used
inpersharecomputation 246,168 72,534 253,862 68,916 262,078 65,135
Basic net income (loss) per share
Continuing operations $ 26.69 $ 26.69 $ 30.17 $ 30.17 $ 32.97 $ 32.97
Discontinued operations 0 0 0 0 (0.16) (0.16)
Basic net income per share $ 26.69 $ 26.69 $ 30.17 $ 30.17 $ 32.81 $ 32.81
Diluted net income per share:
Numerator
Allocation of undistributed earnings for
basic computation—continuing operations $ 6,569 $ 1,936 $ 7,658 $ 2,079 $ 8,641 $ 2,147
Reallocation of undistributed earnings
asa result of conversion of Class B
toClassAshares 1,936 0 2,079 0 2,147 0
Reallocation of undistributed earnings
toClass B shares 0 (26) 0 (27) 0 (31)
Allocation of undistributed
earnings—continuing operations $ 8,505 $ 1,910 $ 9,737 $ 2,052 $ 10,788 $ 2,116
Allocation of undistributed earnings for basic
computation—discontinued operations $ 0 $ 0 $ 0 $ 0 $ (41) $ (10)
Reallocation of undistributed earnings
asa result of conversion of Class B
toClassAshares 0 0 0 0 (10) 0
Reallocation of undistributed earnings
toClass B shares 0 0 0 0 0 0
Allocation of undistributed
earnings—discontinued operations $ 0 $ 0 $ 0 $ 0 $ (51) $ (10)
Denominator
Number of shares used in basic
computation 246,168 72,534 253,862 68,916 262,078 65,135
Weighted-average eff ect of dilutive securities
Add:
Conversion of Class B to ClassA common
shares outstanding 72,534 0 68,916 0 65,135 0
Employee stock options, including
warrants issued under Transferable Stock
Option program 3,410 71 2,958 46 2,944 34
Restricted stock units 1,139 0 1,478 0 2,148 0
Number of shares used
inpersharecomputation 323,251 72,605 327,214 68,962 332,305 65,169
Diluted net income (loss) per share:
Continuing operations 26.31 26.31 29.76 29.76 32.46 32.46
Discontinued operations 0.00 0.00 0.00 0.00 (0.15) (0.15)
Diluted net income per share $ 26.31 $ 26.31 $ 29.76 $ 29.76 $ 32.31 $ 32.31
The net income per share amounts are the same for ClassA and Class B common stock because the holders of each class are
legally entitled to equal per share distributions whether through dividends or in liquidation.
Contents
44