Google 2012 Annual Report Download - page 44
Download and view the complete annual report
Please find page 44 of the 2012 Google annual report below. You can navigate through the pages in the report by either clicking on the pages listed below, or by using the keyword search tool below to find specific information within the annual report.-
 1
1 -
2
-
3
-
4
-
5
-
6
-
7
-
8
-
9
-
10
-
11
-
12
-
13
-
14
-
15
-
16
-
17
-
18
-
19
-
20
-
21
-
22
-
23
-
24
-
25
-
26
-
27
-
28
-
29
-
30
-
31
-
32
-
33
-
 34
34 -
 35
35 -
 36
36 -
 37
37 -
 38
38 -
 39
39 -
 40
40 -
 41
41 -
 42
42 -
 43
43 -
 44
44 -
 45
45 -
 46
46 -
 47
47 -
 48
48 -
 49
49 -
 50
50 -
 51
51 -
 52
52 -
 53
53 -
 54
54 -
55
-
56
-
57
-
58
-
59
-
60
-
61
-
62
-
63
-
64
-
65
-
66
-
67
-
68
-
69
-
70
-
71
-
72
-
73
-
74
-
75
-
76
-
77
-
78
-
79
-
80
-
81
-
82
-
83
-
84
-
85
-
86
-
87
-
88
-
89
-
90
-
91
-
92
 |
 |

38 GOOGLE INC. |Form10-K
PART II
ITEM7.Management’s Discussion and Analysis of Financial Condition and Results ofOperations
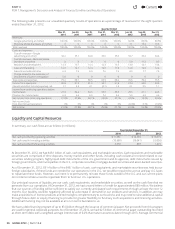
Cash Used In Investing Activities
Cash used in investing activities in 2012 of $13,056million was primarily attributable to cash used in acquisitions and other
investments of $11,264million, including $9,518million net cash paid in connection with the acquisition of Motorola, and capital
expenditures of $3,273million related primarily to our facilities, data centers, and related equipment. These decreases were
partially off set by net maturities and sales of marketable securities of $1,770million. Also, in connection with our securities lending
program, we returned cash collateral of $334million. See Note3 of Notes to Consolidated Financial Statements included in Item8
of this Annual Report on Form 10-K for further information about our securities lending program.
Cash used in investing activities in 2011 of $19,041million was primarily attributable to net purchases of marketable securities of
$12,926million, capital expenditures of $3,438million related principally to our facilities, data centers, and related equipment, and
cash used in acquisitions and other investments of $2,328million, including $676million paid in connection with the acquisition
of ITA Software, Inc. Also, in connection with our securities lending program, we returned $354million of cash collateral.
Cash used in investing activities in 2010 of $10,680million was primarily attributable to net purchases of marketable securities
of $6,886million, capital expenditures of $4,018million of which $1.8billion was for the purchase of an o ce building in New
York City in December2010, and remaining amounts related principally to our data centers and related equipment, and cash
consideration used in acquisitions and other investments of $1,067million. Also, in connection with our securities lending program,
we received $2,361million of cash collateral which was invested in reverse repurchase agreements.
In order to manage expected increases in internet tra c, advertising transactions, and new products and services, and to support
our overall global business expansion, we expect to make signifi cant investments in our systems, data centers, corporate facilities,
information technology infrastructure, and employees in 2013 and thereafter. However, the amount of our capital expenditures
has fl uctuated and may continue to fl uctuate on a quarterly basis.
In addition, we expect to spend a signifi cant amount of cash on acquisitions and other investments from time to time. These
acquisitions generally enhance the breadth and depth of our expertise in engineering and other functional areas, our technologies,
and our product off erings.
In December2012, we signed an agreement for the disposition of Motorola Home business for total consideration of approximately
$2.35billion in cash and stock subject to certain adjustments. We expect the transaction to close in 2013.
Cash Provided by Financing Activities
Cash provided by fi nancing activities in 2012 of $1,229million was primarily driven by net proceeds of $1,328million from short-
term debt issued under our commercial paper program and excess tax benefi ts from stock-based award activities of $188million.
This was partially off set by net payments for stock-based award activities of $287million.
Cash provided by fi nancing activities in 2011 of $807million was primarily driven by net proceeds of $726million of debt issued
and excess tax benefi ts from stock-based award activities of $86million.
Cash provided by fi nancing activities in 2010 of $3,050million was primarily driven by $3,463million of net cash proceeds from the
issuance of commercial paper and a promissory note. This was partially off set by $801million in stock repurchases in connection
with our acquisitions of AdMob, Inc. and On2 Technologies, Inc., as well as net proceeds from stock-based award activities of
$294million, and excess tax benefi ts from stock-based award activities of $94million.
Contractual Obligations as of December31, 2012
(in millions)
Payments due by period
Total
Less than
1year 1-3 years 3-5 years
More than
5years
Operating lease obligations, net of sublease income amounts $3,619 $ 466 $ 870 $ 688 $1,595
Purchase obligations 2,123 942 943 119 119
Long-term debt obligations 3,401 70 1,121 1,083 1,127
Other long-term liabilities refl ected on our balance sheet 236 41 119 40 36
Total contractual obligations $9,379 $1,519 $3,053 $1,930 $2,877
The above table does not include future rental income of $649million related to the leases that we assumed in connection with
our building purchases.
Contents
44