Google 2012 Annual Report Download - page 41
Download and view the complete annual report
Please find page 41 of the 2012 Google annual report below. You can navigate through the pages in the report by either clicking on the pages listed below, or by using the keyword search tool below to find specific information within the annual report.-
 1
1 -
2
-
3
-
4
-
5
-
6
-
7
-
8
-
9
-
10
-
11
-
12
-
13
-
14
-
15
-
16
-
17
-
18
-
19
-
20
-
21
-
22
-
23
-
24
-
25
-
26
-
27
-
28
-
29
-
30
-
 31
31 -
 32
32 -
 33
33 -
 34
34 -
 35
35 -
 36
36 -
 37
37 -
 38
38 -
 39
39 -
 40
40 -
 41
41 -
 42
42 -
 43
43 -
 44
44 -
 45
45 -
 46
46 -
 47
47 -
 48
48 -
 49
49 -
 50
50 -
 51
51 -
52
-
53
-
54
-
55
-
56
-
57
-
58
-
59
-
60
-
61
-
62
-
63
-
64
-
65
-
66
-
67
-
68
-
69
-
70
-
71
-
72
-
73
-
74
-
75
-
76
-
77
-
78
-
79
-
80
-
81
-
82
-
83
-
84
-
85
-
86
-
87
-
88
-
89
-
90
-
91
-
92
 |
 |
35GOOGLE INC. |Form10-K
PART II
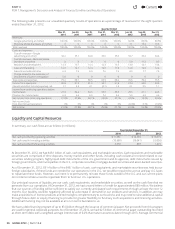
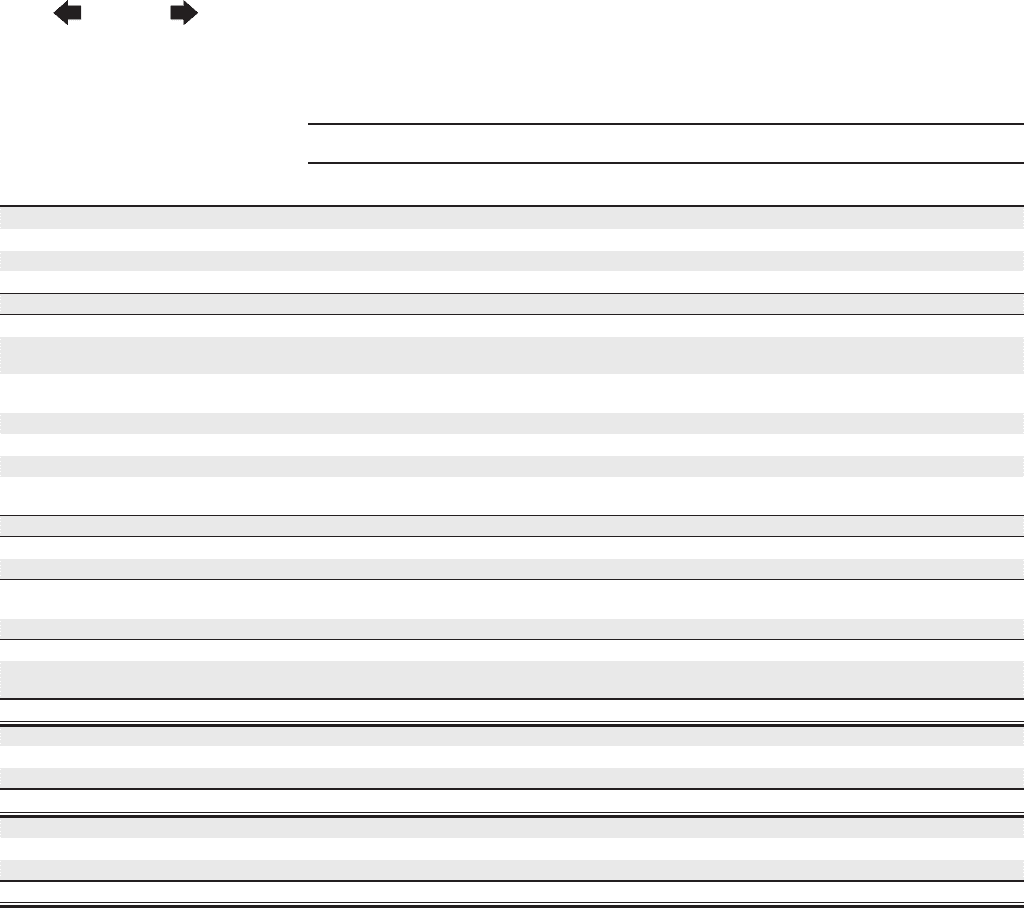
ITEM7.Management’s Discussion and Analysis of Financial Condition and Results ofOperations
Quarter Ended
Mar31,
2011 Jun30,
2011 Sep30,
2011 Dec31,
2011 Mar31,
2012 Jun30,
2012 Sep30,
2012 Dec31,
2012
(In millions, except per share amounts)
(unaudited)
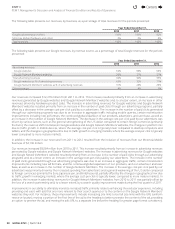
Consolidated Statements of Income Data:
Revenues:
Google (advertising and other) $ 8,575 $ 9,026 $ 9,720 $10,584 $10,645 $10,964 $11,526 $12,905
Motorola Mobile (hardware and other) 0 0 0 0 0 843 1,778 1,514
Total revenues 8,575 9,026 9,720 10,584 10,645 11,807 13,304 14,419
Costs and expenses:
Cost of revenues—Google
(advertising and other) 2,936 3,172 3,378 3,702 3,789 3,984 4,440 4,963
Cost of revenues—Motorola Mobile
(hardware and other) 0 0 0 0 0 693 1,515 1,250
Research and development 1,226 1,234 1,404 1,298 1,441 1,538 1,879 1,935
Sales and marketing 1,026 1,091 1,204 1,268 1,269 1,413 1,710 1,751
General and administrative 591 648 676 809 757 942 1,020 1,126
Charge related to the resolution of
Department of Justice investigation 500 0 0 0 0 0 0 0
Total costs and expenses 6,279 6,145 6,662 7,077 7,256 8,570 10,564 11,025
Income from operations 2,296 2,881 3,058 3,507 3,389 3,237 2,740 3,394
Interest and other income (expense), net 96 204 302 (18) 156 253 65 152
Income from continuing operations
beforeincome taxes 2,392 3,085 3,360 3,489 3,545 3,490 2,805 3,546
Provision for income taxes 594 580 631 784 655 657 647 639
Net income from continuing operations $ 1,798 $ 2,505 $ 2,729 $ 2,705 $ 2,890 $ 2,833 $ 2,158 $ 2,907
Net income (loss) from discontinued
operations 0 0 0 0 0 (48) 18 (21)
Net income $1,798 $2,505 $2,729 $ 2,705 $ 2,890 $ 2,785 $ 2,176 $ 2,886
Net income (loss) per share—basic:
Continuing operations $ 5.59 $ 7.77 $ 8.44 $ 8.34 $ 8.88 $ 8.68 $ 6.59 $ 8.83
Discontinued operations 0 0 0 0 0 (0.14) 0.05 $ (0.06)
Net income per share—basic $ 5.59 $ 7.77 $ 8.44 $ 8.34 $ 8.88 $ 8.54 $6.64 $ 8.77
Net income (loss) per share—diluted:
Continuing operations $ 5.51 $ 7.68 $ 8.33 $ 8.22 $ 8.75 $ 8.56 $ 6.48 $ 8.68
Discontinued operations 0 0 0 0 0 (0.14) 0.05 (0.06)
Net income per share—diluted $ 5.51 $ 7.68 $ 8.33 $ 8.22 $ 8.75 $ 8.42 $ 6.53 $ 8.62
4
Contents
4