Google 2012 Annual Report Download - page 30
Download and view the complete annual report
Please find page 30 of the 2012 Google annual report below. You can navigate through the pages in the report by either clicking on the pages listed below, or by using the keyword search tool below to find specific information within the annual report.-
 1
1 -
2
-
3
-
4
-
5
-
6
-
7
-
8
-
9
-
10
-
11
-
12
-
13
-
14
-
15
-
16
-
17
-
18
-
19
-
 20
20 -
 21
21 -
 22
22 -
 23
23 -
 24
24 -
 25
25 -
 26
26 -
 27
27 -
 28
28 -
 29
29 -
 30
30 -
 31
31 -
 32
32 -
 33
33 -
 34
34 -
 35
35 -
 36
36 -
 37
37 -
 38
38 -
 39
39 -
 40
40 -
41
-
42
-
43
-
44
-
45
-
46
-
47
-
48
-
49
-
50
-
51
-
52
-
53
-
54
-
55
-
56
-
57
-
58
-
59
-
60
-
61
-
62
-
63
-
64
-
65
-
66
-
67
-
68
-
69
-
70
-
71
-
72
-
73
-
74
-
75
-
76
-
77
-
78
-
79
-
80
-
81
-
82
-
83
-
84
-
85
-
86
-
87
-
88
-
89
-
90
-
91
-
92
 |
 |

24 GOOGLE INC. |Form10-K
PART II
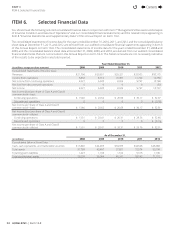
ITEM6.Selected Financial Data
ITEM6. Selected Financial Data
You should read the following selected consolidated fi nancial data in conjunction with Item7 “Management’s Discussion and Analysis
of Financial Condition and Results of Operations” and our consolidated fi nancial statements and the related notes appearing in
Item8 “Financial Statements and Supplementary Data” of this Annual Report on Form 10-K.
The consolidated statements of income data for the years ended December31, 2010, 2011, and 2012 and the consolidated balance
sheet data at December31, 2011, and 2012 are derived from our audited consolidated fi nancial statements appearing in Item8
of this Annual Report on Form 10-K. The consolidated statements of income data for the years ended December31, 2008 and
2009, and the consolidated balance sheet data at December31, 2008, 2009, and 2010, are derived from our audited consolidated
fi nancial statements that are not included in this Annual Report on Form10-K. The historical results are not necessarily indicative
of the results to be expected in any future period.
(in millions, except per share amounts)
Year Ended December31,
2008 2009 2010 2011 2012
Consolidated Statements of IncomeData:
Revenues $21,796 $23,651 $29,321 $37,905 $50,175
Income from operations 6,632 8,312 10,381 11,742 12,760
Net income from continuing operations 4,227 6,520 8,505 9,737 10,788
Net loss from discontinued operations 0 0 0 0 (51)
Net income 4,227 6,520 8,505 9,737 10,737
Net income (loss) per share of ClassA and ClassB
common stock—basic
Continuing operations $ 13.46 $ 20.62 $ 26.69 $ 30.17 $ 32.97
Discontinued operations 0 0 0 0 $ (0.16)
Net income per share of ClassA and ClassB
common stock—basic $ 13.46 $ 20.62 $ 26.69 $ 30.17 $ 32.81
Net income (loss) per share of ClassA and ClassB
common stock—diluted
Continuing operations $ 13.31 $ 20.41 $ 26.31 $ 29.76 $ 32.46
Discontinued operations 0 0 0 0 $ (0.15)
Net income per share of ClassA andClassB
common stock—diluted $ 13.31 $ 20.41 $ 26.31 $ 29.76 $ 32.31
(in millions)
As of December31,
2008 2009 2010 2011 2012
Consolidated Balance Sheet Data:
Cash, cash equivalents, and marketable securities $15,846 $24,485 $34,975 $44,626 $48,088
Total assets 31,768 40,497 57,851 72,574 93,798
Total long-term liabilities 1,227 1,746 1,614 5,516 7,746
Total stockholders’ equity 28,239 36,004 46,241 58,145 71,715
Contents
44