Google 2012 Annual Report Download - page 56
Download and view the complete annual report
Please find page 56 of the 2012 Google annual report below. You can navigate through the pages in the report by either clicking on the pages listed below, or by using the keyword search tool below to find specific information within the annual report.-
 1
1 -
2
-
3
-
4
-
5
-
6
-
7
-
8
-
9
-
10
-
11
-
12
-
13
-
14
-
15
-
16
-
17
-
18
-
19
-
20
-
21
-
22
-
23
-
24
-
25
-
26
-
27
-
28
-
29
-
30
-
31
-
32
-
33
-
34
-
35
-
36
-
37
-
38
-
39
-
40
-
41
-
42
-
43
-
44
-
45
-
 46
46 -
 47
47 -
 48
48 -
 49
49 -
 50
50 -
 51
51 -
 52
52 -
 53
53 -
 54
54 -
 55
55 -
 56
56 -
 57
57 -
 58
58 -
 59
59 -
 60
60 -
 61
61 -
 62
62 -
 63
63 -
 64
64 -
 65
65 -
 66
66 -
67
-
68
-
69
-
70
-
71
-
72
-
73
-
74
-
75
-
76
-
77
-
78
-
79
-
80
-
81
-
82
-
83
-
84
-
85
-
86
-
87
-
88
-
89
-
90
-
91
-
92
 |
 |

50 GOOGLE INC. |Form10-K
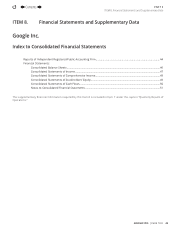
PART II
ITEM8.Consolidated Statements of Cash Flows
Google Inc.
Consolidated Statements of Cash Flows
(In millions)
Year Ended December31,
2010 2011 2012
Operating activities
Net income $ 8,505 $ 9,737 $ 10,737
Adjustments:
Depreciation and amortization of property and equipment 1,067 1,396 1,988
Amortization of intangible and other assets 329 455 974
Stock-based compensation expense 1,376 1,974 2,692
Excess tax benefi ts from stock-based award activities (94) (86) (188)
Deferred income taxes 9 343 (266)
Impairment of equity investments 0 110 0
Gain on divestiture of business 0 0 (188)
Other (12) 6 (28)
Changes in assets and liabilities, net of eff ects of acquisitions:
Accounts receivable (1,129) (1,156) (787)
Income taxes, net 102 731 1,492
Inventories 0 (30) 301
Prepaid revenue share, expenses and other assets (414) (232) (833)
Accounts payable 272 101 (499)
Accrued expenses and other liabilities 745 795 762
Accrued revenue share 214 259 299
Deferred revenue 111 162 163
Net cash provided by operating activities 11,081 14,565 16,619
Investing activities
Purchases of property and equipment (4,018) (3,438) (3,273)
Purchases of marketable securities (43,985) (61,672) (33,410)
Maturities and sales of marketable securities 37,099 48,746 35,180
Investments in non-marketable equity securities (320) (428) (696)
Cash collateral related to securities lending 2,361 (354) (334)
Investments in reverse repurchase agreements (750) 5 45
Acquisitions, net of cash acquired and proceeds received from divestiture,
andpurchases of intangible and other assets (1,067) (1,900) (10,568)
Net cash used in investing activities (10,680) (19,041) (13,056)
Financing activities
Net proceeds (payments) from stock-based award activities 294 (5) (287)
Excess tax benefi ts from stock-based award activities 94 86 188
Repurchase of common stock in connection with acquisitions (801) 0 0
Proceeds from issuance of debt, net of costs 5,246 10,905 16,109
Repayment of debt (1,783) (10,179) (14,781)
Net cash provided by fi nancing activities 3,050 807 1,229
Eff ect of exchange rate changes on cash and cash equivalents (19) 22 3
Net increase (decrease) in cash and cash equivalents 3,432 (3,647) 4,795
Cash and cash equivalents at beginning of year 10,198 13,630 9,983
Cash and cash equivalents at end of year $ 13,630 $ 9,983 $ 14,778
Supplemental disclosures of cash fl ow information
Cash paid for interest $ 0 $40 $74
Cash paid for taxes $ 2,175 $ 1,471 $ 2,034
Non-cash fi nancing activity:
Fair value of stock-based awards assumed in connection with acquisitions $ 750 $ 0 $ 41
See accompanying notes.
Contents
44