Google 2012 Annual Report Download - page 63
Download and view the complete annual report
Please find page 63 of the 2012 Google annual report below. You can navigate through the pages in the report by either clicking on the pages listed below, or by using the keyword search tool below to find specific information within the annual report.-
 1
1 -
2
-
3
-
4
-
5
-
6
-
7
-
8
-
9
-
10
-
11
-
12
-
13
-
14
-
15
-
16
-
17
-
18
-
19
-
20
-
21
-
22
-
23
-
24
-
25
-
26
-
27
-
28
-
29
-
30
-
31
-
32
-
33
-
34
-
35
-
36
-
37
-
38
-
39
-
40
-
41
-
42
-
43
-
44
-
45
-
46
-
47
-
48
-
49
-
50
-
51
-
52
-
 53
53 -
 54
54 -
 55
55 -
 56
56 -
 57
57 -
 58
58 -
 59
59 -
 60
60 -
 61
61 -
 62
62 -
 63
63 -
 64
64 -
 65
65 -
 66
66 -
 67
67 -
 68
68 -
 69
69 -
 70
70 -
 71
71 -
 72
72 -
 73
73 -
74
-
75
-
76
-
77
-
78
-
79
-
80
-
81
-
82
-
83
-
84
-
85
-
86
-
87
-
88
-
89
-
90
-
91
-
92
 |
 |

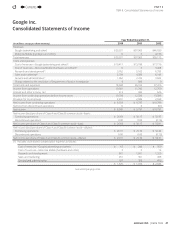
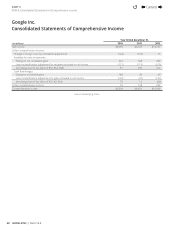
57GOOGLE INC. |Form10-K
PART II
ITEM8.Notes to Consolidated Financial Statements
NOTE3. Financial Instruments
Fair Value Measurements
We measure our cash equivalents, marketable securities, and foreign currency and interest rate derivative contracts at fair value.
Fair value is an exit price, representing the amount that would be received to sell an asset or paid to transfer a liability in an orderly
transaction between market participants. As such, fair value is a market-based measurement that should be determined based
on assumptions that market participants would use in pricing an asset or a liability. A three-tier fair value hierarchy is established
as a basis for considering such assumptions and for inputs used in the valuation methodologies in measuring fair value:
Level 1—Observable inputs that refl ect quoted prices (unadjusted) for identical assets or liabilities in active markets.
Level 2—Include other inputs that are based upon quoted prices for similar instruments in active markets, quoted prices for
identical or similar instruments in markets that are not active, and model-based valuation techniques for which all signifi cant
inputs are observable in the market or can be derived from observable market data. Where applicable, these models project
future cash fl ows and discount the future amounts to a present value using market-based observable inputs including interest
rate curves, foreign exchange rates, and credit ratings.
Level 3—Unobservable inputs that are supported by little or no market activities.
The fair value hierarchy also requires an entity to maximize the use of observable inputs and minimize the use of unobservable
inputs when measuring fair value.
Based on the fair value hierarchy, we classify our cash equivalents and marketable securities within Level 1 or Level 2. This is
because we value our cash equivalents and marketable securities using quoted market prices or alternative pricing sources and
models utilizing market observable inputs. We classify our foreign currency and interest rate derivative contracts primarily within
Level 2 as the valuation inputs are based on quoted prices and market observable data of similar instruments.
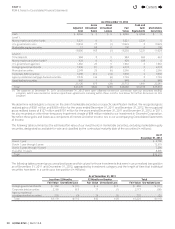
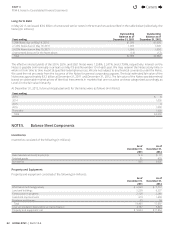
Cash, Cash Equivalents and Marketable Securities
The following tables summarize our cash, cash equivalents and marketable securities measured at adjusted cost, gross unrealized
gains, gross unrealized losses and fair value by signifi cant investment categories as of December31, 2011 and December31,
2012 (in millions):
As of December31, 2011
Adjusted
Cost
Gross
Unrealized
Gains
Gross
Unrealized
Losses
Fair
Value
Cash
and Cash
Equivalents
Marketable
Securities
Cash $ 4,712 $ 0 $ 0 $ 4,712 $4,712 $ 0
Level 1:
Money market and other funds 3,202 0 0 3,202 3,202 0
U.S. government notes 11,475 104 0 11,579 0 11,579
Marketable equity securities 228 79 0 307 0 307
14,905 183 0 15,088 3,202 11,886
Level 2:
Time deposits 1,029 0 0 1,029 534 495
Money market and other funds(1) 1,260 0 0 1,260 1,260 0
U.S. government agencies 6,486 15 0 6,501 275 6,226
Foreign government bonds 1,608 32 (11) 1,629 0 1,629
Municipal securities 1,775 19 0 1,794 0 1,794
Corporate debt securities 6,023 187 (98) 6,112 0 6,112
Agency residential mortgage-backed securities 6,359 147 (5) 6,501 0 6,501
24,540 400 (114) 24,826 2,069 22,757
Total $44,157 $583 $(114 ) $44,626 $9,983 $ 34,643
4
Contents
4