Google 2012 Annual Report Download - page 43
Download and view the complete annual report
Please find page 43 of the 2012 Google annual report below. You can navigate through the pages in the report by either clicking on the pages listed below, or by using the keyword search tool below to find specific information within the annual report.-
 1
1 -
2
-
3
-
4
-
5
-
6
-
7
-
8
-
9
-
10
-
11
-
12
-
13
-
14
-
15
-
16
-
17
-
18
-
19
-
20
-
21
-
22
-
23
-
24
-
25
-
26
-
27
-
28
-
29
-
30
-
31
-
32
-
 33
33 -
 34
34 -
 35
35 -
 36
36 -
 37
37 -
 38
38 -
 39
39 -
 40
40 -
 41
41 -
 42
42 -
 43
43 -
 44
44 -
 45
45 -
 46
46 -
 47
47 -
 48
48 -
 49
49 -
 50
50 -
 51
51 -
 52
52 -
 53
53 -
54
-
55
-
56
-
57
-
58
-
59
-
60
-
61
-
62
-
63
-
64
-
65
-
66
-
67
-
68
-
69
-
70
-
71
-
72
-
73
-
74
-
75
-
76
-
77
-
78
-
79
-
80
-
81
-
82
-
83
-
84
-
85
-
86
-
87
-
88
-
89
-
90
-
91
-
92
 |
 |

37GOOGLE INC. |Form10-K
PART II
ITEM7.Management’s Discussion and Analysis of Financial Condition and Results ofOperations
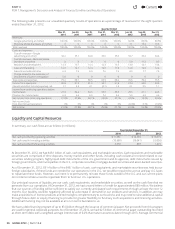
paper borrowings during the year were $2.2billion and the maximum amount outstanding during the year was $2.7billion.In
conjunction with this program, we have a $3.0billion revolving credit facility expiring in July2016. The interest rate for the credit
facility is determined based on a formula using certain market rates. As of December31, 2012, we were in compliance with the
fi nancial covenant in the credit facility and no amounts were outstanding.
In May2011, we issued $3.0billion of unsecured senior notes in three equal tranches, due in 2014, 2016, and2021, with stated
interest rates of 1.25%, 2.125%, and 3.625%. The net proceeds from the sale of the notes were used to repay a portion of our
outstanding commercial paper and for general corporate purposes. As of December31, 2012, the total carrying value and
estimated fair value of these notes were $3.0billion and $3.2billion. The estimated fair value was based on quoted prices for our
publicly-traded debt as of December31, 2012. We are not subject to any fi nancial covenants under the notes.
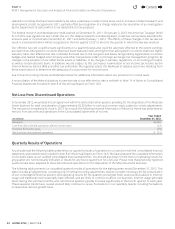
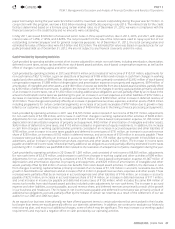
Cash Provided by Operating Activities
Cash provided by operating activities consist of net income adjusted for certain non-cash items, including amortization, depreciation,
deferred income taxes, excess tax benefi ts from stock-based award activities, stock-based compensation expense, as well as the
eff ect of changes in working capital and other activities.
Cash provided by operating activities in 2012 was $16,619million and consisted of net income of $10,737million, adjustments for
non-cash items of $5,172million, a gain on divestiture of business of $188million and increase in cash from changes in working
capital and other activities of $898million. Adjustments for non-cash items primarily consisted of $2,692million of stock-based
compensation expense, $1,988million of depreciation and amortization expense on property and equipment, $974million of
amortization of intangible and other assets, and $188million of excess tax benefi ts from stock-based award activities, partially off set
by $266million of deferred income taxes. In addition, the increase in cash from changes in working capital activities primarily consisted
of an increase in income taxes, net, of $1,492million including additional tax obligations accrued, partially off set by an increase in the
amount of estimated income taxes we paid during the year, an increase in accrued expenses and other liabilities of $762million, a
decrease in inventories of $301million, an increase accrued revenue share of $299million, and an increase in deferred revenue of
$163million. These changes were partially off set by an increase in prepaid revenue share, expenses, and other assets of $833million
including prepayments for certain content arrangements, an increase of accounts receivable of $787million due to growth in fees
billed to our customers, and a decrease in accounts payable of $499million due to the timing of invoice processing and payments.
Cash provided by operating activities in 2011 was $14,565million and consisted of net income of $9,737million, adjustments
for non-cash items of $4,198million, and increase in cash from changes in working capital and other activities of $630million.
Adjustments for non-cash items primarily consisted of $1,974million of stock-based compensation expense, $1,396million of
depreciation and amortization expense of property and equipment, $455million of amortization of intangible and other assets,
$343million of deferred income taxes, and $110million related to impairment of equity investments. In addition, the increase
in cash from changes in working capital activities primarily consisted of an increase in accrued expenses and other liabilities of
$795million, a net increase in income taxes payable and deferred income taxes of $731million, an increase in accrued revenue
share of $259million, an increase of $162million in deferred revenue, and an increase of $101million in accounts payable. These
increases were partially off set by an increase in accounts receivable of $1,156million due to the growth in fees billed to our
advertisers, and an increase in prepaid revenue share, expenses and other assets of $262million. The increase in income taxes
payable and deferred income taxes refl ected primarily additional tax obligations accrued, partially off set by estimated income taxes
paid during 2011. In addition, we paid $500million related to the resolution of a Department of Justice investigation during the year.
Cash provided by operating activities in 2010 was $11,081million, and consisted of net income of $8,505million, adjustments
for non-cash items of $2,675million, and decrease in cash from changes in working capital and other activities of $99million.
Adjustments for non-cash items primarily consisted of $1,376million of stock-based compensation expense, $1,067million of
depreciation and amortization expense on property and equipment, and $329million of amortization of intangible and other
assets, partially off set by $94million of excess tax benefi ts from stock-based award activities. In addition, the decrease in cash
from changes in working capital activities primarily consisted of an increase of $1,129million in accounts receivable due to the
growth in fees billed to our advertisers and an increase of $414million in prepaid revenue share, expenses and other assets. These
increases were partially off set by an increase in accrued expenses and other liabilities of $745million, an increase in accounts
payable of $272million, an increase in accrued revenue share of $214million, an increase in deferred revenue of $111million,
and a net increase in income tax payable and deferred income taxes of $102million, which includes the same $94million of
excess tax benefi ts from stock-based award activities included under adjustments for non-cash items. The increase in accrued
expense and other liabilities, accounts payable, accrued revenue share, and deferred revenues are primarily a result of the growth
in our business and headcount. The increase in net income taxes payable and deferred income taxes was primarily a result of
additional tax obligations accrued, partially off set by the release of certain tax reserves as a result of the settlement of our tax
audits for our 2005 and 2006 tax years.
As we expand our business internationally, we have off ered payment terms to certain advertisers that are standard in their locales
but longer than terms we would generally off er to our domestic advertisers. In addition, we continue to evaluate our Motorola
restructuring plan, and may incur additional charges, some of which may be signifi cant. This may increase our working capital
requirements and may have a negative eff ect on cash provided by our operating activities.
4
Contents
4