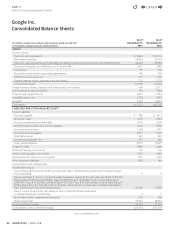
Google 2012 Annual Report Download - page 42
Download and view the complete annual report
Please find page 42 of the 2012 Google annual report below. You can navigate through the pages in the report by either clicking on the pages listed below, or by using the keyword search tool below to find specific information within the annual report.-
 1
1 -
2
-
3
-
4
-
5
-
6
-
7
-
8
-
9
-
10
-
11
-
12
-
13
-
14
-
15
-
16
-
17
-
18
-
19
-
20
-
21
-
22
-
23
-
24
-
25
-
26
-
27
-
28
-
29
-
30
-
31
-
 32
32 -
 33
33 -
 34
34 -
 35
35 -
 36
36 -
 37
37 -
 38
38 -
 39
39 -
 40
40 -
 41
41 -
 42
42 -
 43
43 -
 44
44 -
 45
45 -
 46
46 -
 47
47 -
 48
48 -
 49
49 -
 50
50 -
 51
51 -
 52
52 -
53
-
54
-
55
-
56
-
57
-
58
-
59
-
60
-
61
-
62
-
63
-
64
-
65
-
66
-
67
-
68
-
69
-
70
-
71
-
72
-
73
-
74
-
75
-
76
-
77
-
78
-
79
-
80
-
81
-
82
-
83
-
84
-
85
-
86
-
87
-
88
-
89
-
90
-
91
-
92
 |
 |
36 GOOGLE INC. |Form10-K
PART II
ITEM7.Management’s Discussion and Analysis of Financial Condition and Results ofOperations
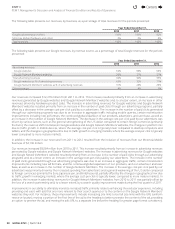
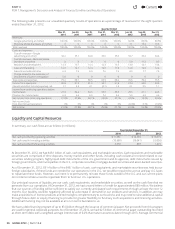
The following table presents our unaudited quarterly results of operations as a percentage of revenues for the eight quarters
ended December31,2012:
Quarter Ended
Mar31,
2011 Jun30,
2011 Sep30,
2011 Dec31,
2011 Mar31,
2012 Jun30,
2012 Sep30,
2012 Dec31,
2012
Revenues:
Google (advertising and other) 100.0% 100.0% 100.0% 100.0% 100.0% 92.9% 86.6% 89.5%
Motorola Mobile (hardware and other) 0 0 0 0 0 7.1 13.4 10.5
Total revenues 100.0% 100.0% 100.0% 100.0% 100.0% 100.0% 100.0% 100.0%
Costs and expenses:
Cost of revenues—Google
(advertising and other) 34.2 35.1 34.8 35.0 35.6 33.7 33.4 34.4
Cost of revenues—Motorola Mobile
(hardware and other) 0 0 0 0 0 5.9 11.3 8.7
Research and development 14.3 13.7 14.4 12.3 13.5 13.0 14.1 13.4
Sales and marketing 12.0 12.1 12.4 12.0 11.9 12.0 12.9 12.2
General and administrative 6.9 7.2 6.9 7.6 7.2 8.0 7.7 7.8
Charge related to the resolution of
Department of Justice investigation 5.8 0 0 0 0 0 0 0
Total costs and expenses 73.2 68.1 68.5 66.9 68.2 72.6 79.4 76.5
Income from operations 26.8 31.9 31.5 33.1 31.8 27.4 20.6 23.5
Interest and other income (expense), net 1.1 2.3 3.1 (0.1) 1.5 2.1 0.5 1.1
Income from continuing operations before
income taxes 27.9 34.2 34.6 33.0 33.3 29.5 21.1 24.6
Provision for income taxes 6.9 6.4 6.5 7.4 6.2 5.5 4.9 4.4
Net income from continuing operations 21.0% 27.8% 28.1% 25.6% 27.1% 24.0% 16.2% 20.2%
Net income (loss)
fromdiscontinuedoperations 0% 0% 0% 0% 0% (0.4%) 0.1% (0.2%)
Net income 21.0% 27.8% 28.1% 25.6% 27.1% 23.6% 16.3% 20.0%
Liquidity and Capital Resources
In summary, our cash fl ows are as follows (in millions):
Year Ended December31,
2010 2011 2012
Net cash provided by operating activities $ 11,081 $ 14,565 $ 16,619
Net cash used in investing activities (10,680) (19,041) (13,056)
Net cash provided by fi nancing activities 3,050 807 1,229
At December31, 2012, we had $48.1billion of cash, cash equivalents, and marketable securities. Cash equivalents and marketable
securities are comprised of time deposits, money market and other funds, including cash collateral received related to our
securities lending program, highly liquid debt instruments of the U.S. government and its agencies, debt instruments issued by
foreign governments, and municipalities in the U.S., corporate securities, mortgage-backed securities and asset-backed securities.
As of December31, 2012, $31.4billion of the $48.1billion of cash, cash equivalents, and marketable securities was held by our
foreign subsidiaries. If these funds are needed for our operations in the U.S., we would be required to accrue and pay U.S. taxes
to repatriate these funds. However, our intent is to permanently reinvest these funds outside of the U.S. and our current plans
do not demonstrate a need to repatriate them to fund our U.S. operations.
Our principal sources of liquidity are our cash, cash equivalents, and marketable securities, as well as the cash fl ow that we
generate from our operations. At December31, 2012, we had unused letters of credit for approximately $89million. We believe
that our sources of funding will be su cient to satisfy our currently anticipated cash requirements through at least the next 12
months. Our liquidity could be negatively aff ected by a decrease in demand for our products and services. In addition, we may
make acquisitions or license products and technologies complementary to our business and may need to raise additional capital
through future debt or equity fi nancing to provide for greater fl exibility to fund any such acquisitions and licensing activities.
Additional fi nancing may not be available at all or on terms favorable to us.
We have a debt fi nancing program of up to $3.0billion through the issuance of commercial paper. Net proceeds from this program
are used for general corporate purposes. As of December31, 2012, we had $2.5billion of commercial paper outstanding recorded
as short-term debt, with a weighted-average interest rate of 0.2% that mature at various dates through 2013. Average commercial
Contents
44