Google 2012 Annual Report Download - page 76
Download and view the complete annual report
Please find page 76 of the 2012 Google annual report below. You can navigate through the pages in the report by either clicking on the pages listed below, or by using the keyword search tool below to find specific information within the annual report.-
 1
1 -
2
-
3
-
4
-
5
-
6
-
7
-
8
-
9
-
10
-
11
-
12
-
13
-
14
-
15
-
16
-
17
-
18
-
19
-
20
-
21
-
22
-
23
-
24
-
25
-
26
-
27
-
28
-
29
-
30
-
31
-
32
-
33
-
34
-
35
-
36
-
37
-
38
-
39
-
40
-
41
-
42
-
43
-
44
-
45
-
46
-
47
-
48
-
49
-
50
-
51
-
52
-
53
-
54
-
55
-
56
-
57
-
58
-
59
-
60
-
61
-
62
-
63
-
64
-
65
-
 66
66 -
 67
67 -
 68
68 -
 69
69 -
 70
70 -
 71
71 -
 72
72 -
 73
73 -
 74
74 -
 75
75 -
 76
76 -
 77
77 -
 78
78 -
 79
79 -
 80
80 -
 81
81 -
 82
82 -
 83
83 -
 84
84 -
 85
85 -
 86
86 -
87
-
88
-
89
-
90
-
91
-
92
 |
 |
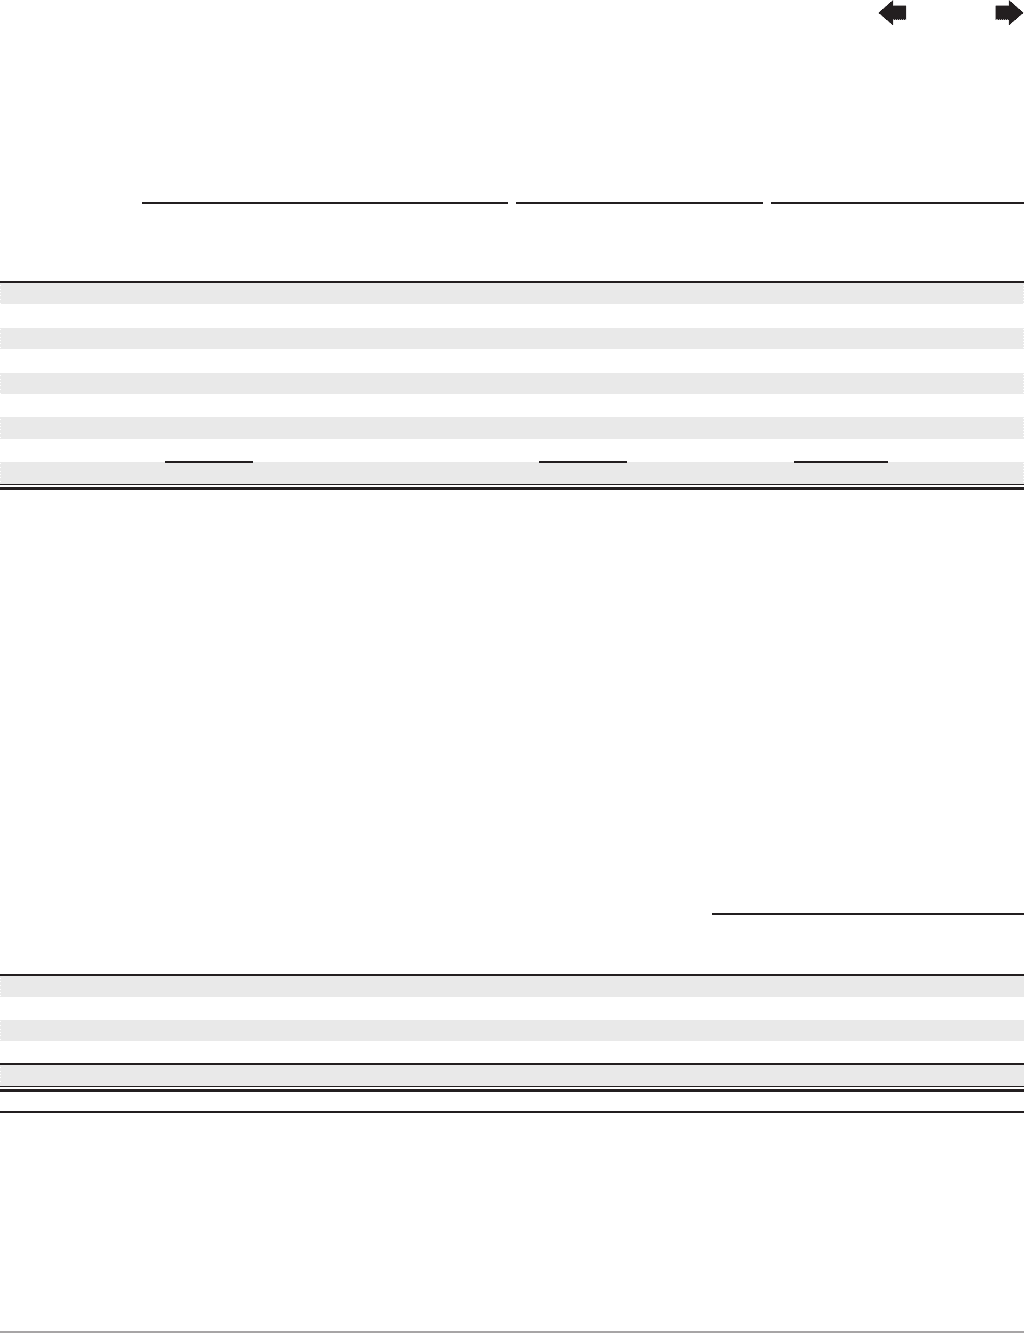
70 GOOGLE INC. |Form10-K
PART II
ITEM8.Notes to Consolidated Financial Statements
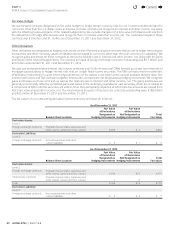
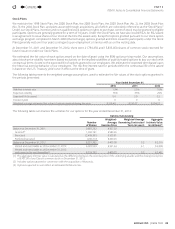
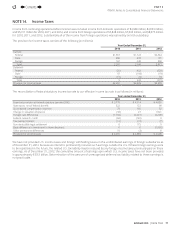
The following table summarizes additional information regarding outstanding, exercisable, and exercisable and vested stock
options at December31,2012:
Range of
ExercisePrices
Options Outstanding Options Exercisable
Options Exercisable
andVested
Number
of Shares
Weighted-
Average
Remaining
Life (in years)
Weighted-
Average
Exercise Price
Number
of Shares
Weighted-
Average
Exercise Price
Number
of Shares
Weighted-
Average
Exercise Price
$0.30–$94.80 116,852 1.7 $ 37.03 116,852 $ 37.03 113,209 $ 35.41
$117.84–$198.41 248,831 2.0 $178.65 248,831 $ 178.65 248,831 $178.65
$205.96–$298.86 282,647 2.4 $275.51 282,552 $ 275.51 282,552 $275.51
$300.97–$399.00 3,998,815 3.8 $309.39 3,642,248 $ 309.57 3,642,248 $309.57
$401.78–$499.07 993,591 5.9 $442.95 766,098 $ 441.55 766,098 $441.55
$501.27–$595.35 1,803,839 6.9 $536.31 848,574 $ 529.82 848,574 $529.82
$601.17–$699.35 1,089,126 8.9 $629.41 120,757 $ 614.76 120,757 $614.76
$710.84–$762.5 17,694 9.7 $762.27 1,290 $ 759.30 1,290 $759.30
$0.30–$762.5 8,551,395 5.2 $405.98 6,027,202 $ 351.28 6,023,559 $351.44
The above tables include approximately 1.6million warrants held by selected fi nancial institutions that were options purchased
from employees under our TSO program, with a weighted-average exercise price of $363.66 and a weighted-average remaining
life of 1.3 years.
During 2012, the number of shares underlying TSOs sold to selected fi nancial institutions under the TSO program was 1,226,983 at
a total value of $365million, or an average of $297.28 per share, including an average premium of $9.35 per share. The premium
is calculated as the diff erence between (a)the sale price of the TSO and (b)the intrinsic value of the TSO, which we defi ne as the
excess, if any, of the price of our ClassA common stock at the time of the sale over the exercise price of the TSO.
The total grant date fair value of stock options vested during 2010, 2011, and 2012 was $690million, $561million, and $489million.
The aggregate intrinsic value of all options and warrants exercised during 2010, 2011, and 2012 was $794million, $674million,
and $827million. These amounts do not include the aggregate sales price of options sold under our TSO program.
As of December31, 2012, there was $386million of unrecognized compensation cost related to outstanding employee stock options.
This amount is expected to be recognized over a weighted-average period of 2.2 years. To the extent the actual forfeiture rate is
diff erent from what we have estimated, stock-based compensation related to these awards will be diff erent from our expectations.
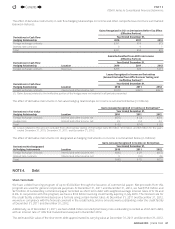
The following table summarizes the activities for our unvested RSUs for the year ended December31, 2012:
Unvested Restricted Stock Units
Number
of Shares
Weighted-Average
Grant-Date
Fair Value
Unvested at December31, 2011 8,822,648 $520.27
Granted(1) 6,704,261 $603.57
Vested (3,884,811) $530.15
Forfeited/canceled (647,171) $543.04
Unvested at December31, 2012 10,994,927 $566.32
Expected to vest after December31, 2012(2) 9,547,995 $566.32
(1) Includes RSUs granted in connection with the acquisition of Motorola.
(2) RSUs expected to vest reflect an estimated forfeiture rate.
As of December31, 2012, there was $4.8billion of unrecognized compensation cost related to unvested employee RSUs. This
amount is expected to be recognized over a weighted-average period of 2.7 years. To the extent the actual forfeiture rate is
diff erent from what we have estimated, stock-based compensation related to these awards will be diff erent from our expectations.
NOTE13. 401(k) Plans
We have two 401(k) Savings Plans (401(k)Plans)that qualify as deferred salary arrangements under Section401(k) of the Internal
Revenue Code. Under these 401(k) Plans, matching contributions are based upon the amount of the employees’ contributions subject
to certain limitations. We contributed approximately $100million, $136million, and $180million during 2010, 2011, and 2012.
Contents
44