Google 2012 Annual Report Download - page 37
Download and view the complete annual report
Please find page 37 of the 2012 Google annual report below. You can navigate through the pages in the report by either clicking on the pages listed below, or by using the keyword search tool below to find specific information within the annual report.-
 1
1 -
2
-
3
-
4
-
5
-
6
-
7
-
8
-
9
-
10
-
11
-
12
-
13
-
14
-
15
-
16
-
17
-
18
-
19
-
20
-
21
-
22
-
23
-
24
-
25
-
26
-
 27
27 -
 28
28 -
 29
29 -
 30
30 -
 31
31 -
 32
32 -
 33
33 -
 34
34 -
 35
35 -
 36
36 -
 37
37 -
 38
38 -
 39
39 -
 40
40 -
 41
41 -
 42
42 -
 43
43 -
 44
44 -
 45
45 -
 46
46 -
 47
47 -
48
-
49
-
50
-
51
-
52
-
53
-
54
-
55
-
56
-
57
-
58
-
59
-
60
-
61
-
62
-
63
-
64
-
65
-
66
-
67
-
68
-
69
-
70
-
71
-
72
-
73
-
74
-
75
-
76
-
77
-
78
-
79
-
80
-
81
-
82
-
83
-
84
-
85
-
86
-
87
-
88
-
89
-
90
-
91
-
92
 |
 |

31GOOGLE INC. |Form10-K
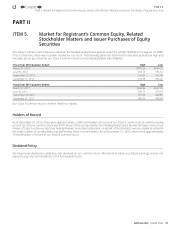
PART II
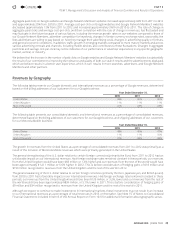
ITEM7.Management’s Discussion and Analysis of Financial Condition and Results ofOperations
Members’ websites, more revenues realized from Google Network Members to whom we pay less revenue share, and, to a lesser
extent, expiration of an AdSense arrangement under which we paid guaranteed minimum revenue share. In addition, there was
an increase in data center costs of $784million, primarily resulting from the depreciation of additional information technology
assets and data center buildings and an increase in labor, energy, and bandwidth costs, and an increase in content acquisition
costs of $236million, primarily related to content displayed on YouTube, partially off set by a decrease in mobile phone costs.
We expect cost of revenues will increase in dollar amount and may increase as a percentage of total revenues in 2013 and in
future periods, primarily as a result of increases in tra c acquisition costs, data center costs, manufacturing and inventory-related
costs, content acquisition costs, credit card and other transaction fees, and other costs. Tra c acquisition costs as a percentage
of advertising revenues may fl uctuate in the future based on a number of factors, including the following:
•The relative growth rates of revenues from our websites and from our Google Network Members’ websites.
•
Whether we are able to enter into more AdSense arrangements that provide for lower revenue share obligations or whether
increased competition for arrangements with existing and potential Google Network Members results in less favorable
revenue share arrangements.
•
Whether we are able to continue to improve the monetization of tra c on our websites and our Google Network Members’
websites.
•
The relative growth rates of expenses associated with distribution arrangements and the related revenues generated,
including whether we share with certain existing and new distribution partners, including mobile distribution partners,
proportionately more of the aggregate advertising fees that we earn from paid clicks derived from search queries these
partners direct to our websites.
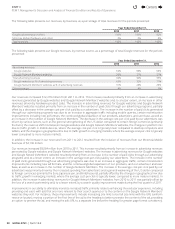
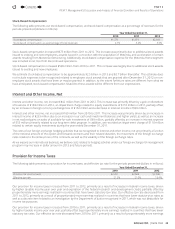
Research and Development
The following table presents our research and development expenses, and research and development expenses as a percentage
of our revenues for the periods presented (dollars in millions):
Year Ended December31,
2010 2011 2012
Research and development expenses $3,762 $5,162 $6,793
Research and development expenses as a percentage of total revenues 12.8% 13.6% 13.5%
Research and development expenses consist primarily of compensation and related costs for personnel responsible for the
research and development of new and existing products and services. We expense research and development costs as incurred.
Research and development expenses increased $1,631million from 2011 to 2012, which includes $710million related to Motorola
Mobile. The remaining increase of $921million was primarily due to an increase in labor and facilities-related costs of $359million,
largely as a result of a 15% increase in research and development headcount, an increase in stock-based compensation expense
of $213million, an increase in depreciation and equipment-related expenses of $147million, and an increase in professional
services expense of $66million.
Research and development expenses increased $1,400million from 2010 to 2011. This increase was primarily due to an increase
in labor and facilities-related costs of $875million, largely as a result of a 23% increase in research and development headcount,
including headcount from acquisitions, as well as an increase in employee base salaries of approximately 10%. In addition, there
was an increase in stock-based compensation expense of $200million.
We expect that research and development expenses will increase in dollar amount and may increase as a percentage of total
revenues in 2013 and future periods because we expect to continue to invest in building the necessary employee and system
infrastructure required to support the development of new, and improve existing, products and services.
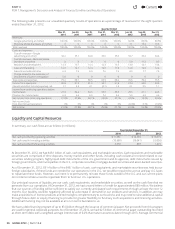
Sales and Marketing
The following table presents our sales and marketing expenses, and sales and marketing expenses as a percentage of total
revenues for the periods presented (dollars in millions):
Year Ended December31,
2010 2011 2012
Sales and marketing expenses $2,799 $4,589 $6,143
Sales and marketing expenses as a percentage of total revenues 9.5% 12.1% 12.2%
4
Contents
4